With proper KPIs, you can keep track of your campaign’s performance and make sure that you’re following the right path towards success. They help cut down the vast amount of data from day-by-day business operations to collect critical insights, allowing businesses to make timely adjustments.
Thus, in order to reach your goals before the deadline, you need to manage and keep your eyes on your KPIs carefully. That’s when KPI tracking software comes to rescue.
This article will introduce the 10 best KPI tracking software for your e-commerce stores. These tools will automatically monitor, report, and visualize KPIs via an appealing dashboard, aggregating the progress and achievements of your business into one place.
What is KPI Tracking Software and How Does it Work?
KPI tracking software refers to incredible tools that automate the monitoring of key performance indicators, displaying them in easy-to-absorb data visualizations.
These tools help business owners and decision-makers define measurable goals that go with their main purposes and keep tabs on their current progress in attaining those goals.
How does KPI tracking software work?
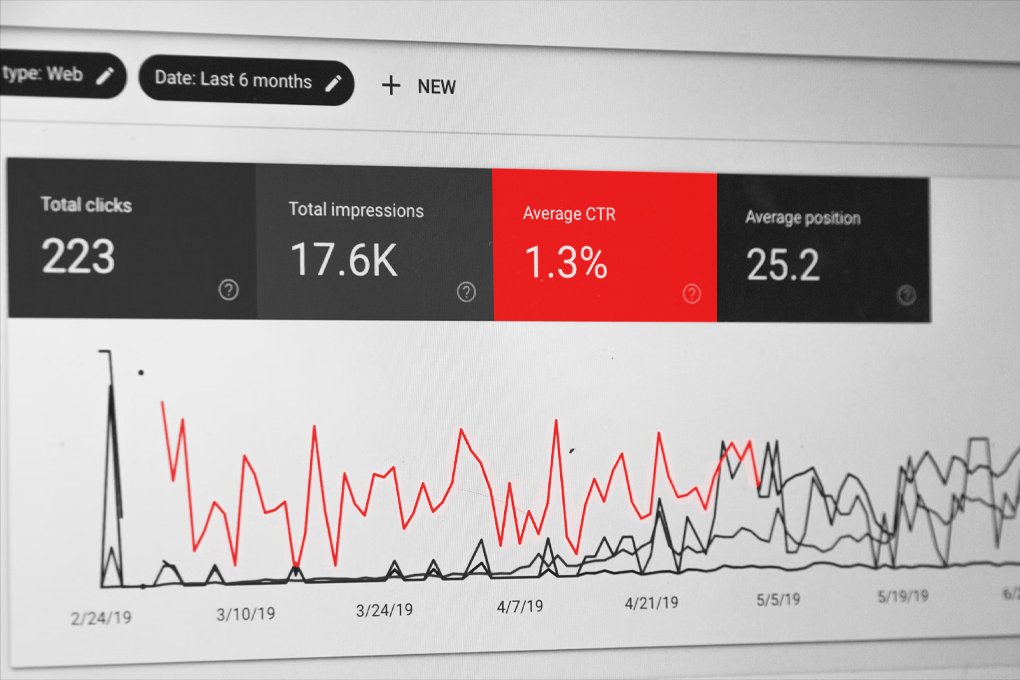
Users simply need to submit their data into the system or connect the platform to their current technologies, then wait for the magic. KPI tracking software gathers all that information in real-time, summarizing it into visual dashboards and brief reports.
Hence, users can have a quick overview of their insights immediately. If KPIs climb above or dip below specific thresholds, there will be instant alerts to maintain a stable course of operations for your e-commerce business.
Best KPI Tracking Software For Your Business
Now it’s time to discover what the most reliable KPI tracking software is. Keep on reading the post to choose the best one for your company.
Tableau
Pricing
- Tableau Viewer: $15 per user/month
- Tableau Explorer: $42 per user/month
- Tableau Creator: $70 per user/month
In addition to being an excellent data analytics solution, Tableau is also KPI tracking software worth considering. Users of every skill level can discover their data, build dashboards and share their data insights with others.
This tool comes with an intuitive interface, drag-and-drop editors, and natural language processing, making the platform much more accessible.
Noticeably, the solution targets data literacy for all, not just for analysts, utilizing a self-service model in which users can drill down, filter, and combine data via beautiful dashboards to dive deeper for answers.
Boasting one of the leading tools for data visualizations, Tableau offers many ways to monitor KPIs via dashboards, charts, graphs, maps, etc. E-commerce owners can create thresholds for KPIs to clearly delimit successes and failures.
Moreover, it also supports KPI tracking on its mobile app via Metrics and alerts via push notifications, which results in a consistent view of KPIs without using various dashboards and filters.
SimpleKPI
Pricing
- A free trial: 14 days
- Fixed plan: $99/month or $89.1/month
With SimpleKPI, data management doesn’t have to be complicated. This KPI tracking software brings everything you need to track and visualize your business metrics.
You can easily use intuitive features to set up and keep tabs on all types of performance management initiatives, whether you’re a beginner or an experienced professional.
SimpleKPI develops an easy-to-use dashboard that handles complex data and converts it into accessible visuals. Besides, users can create KPI reports for businesses, departments, and teams of all sizes, getting a big picture of your growth towards aims and goals.
Furthermore, users can also delve into their data with KPI analytics, comparing trends over various periods and uncovering the root causes of any successes and failures.
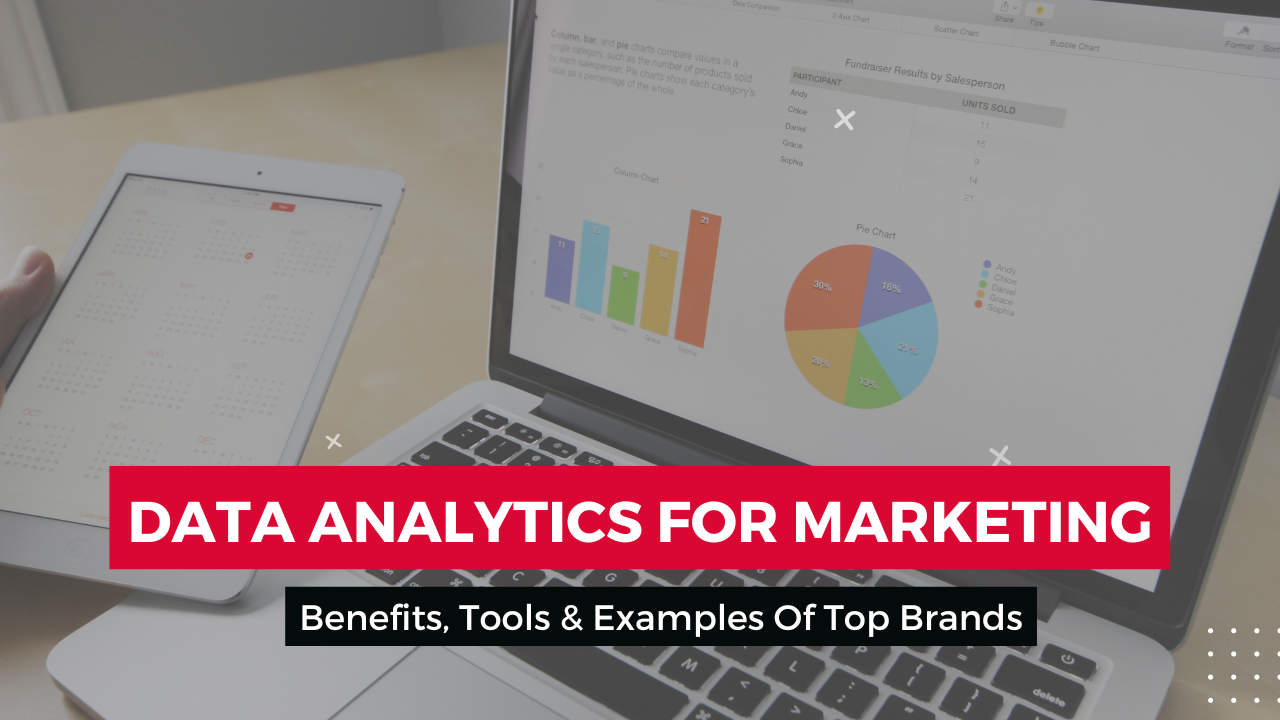
| Suggested for you: Data Analytics For Marketing: Benefits, Tools And Top Brand Examples | |
Power BI
Pricing
- Power BI free version
- Power BI Pro: $9.99 per user/month
- Power BI Premium: $20 per user/month or $4,995 per capacity/month
As a dominant data-driven analytics SaaS platform, Microsoft Power BI offers business insights via data visualization and reporting. If you’re already used to Microsoft technologies, you will fall in love with Power BI’s intuitive design and multiple formatting options.
This KPI tracking software provides plenty of catching dashboards and powerful visualization capabilities. Its visualization tool can convert any visualization into a KPI managing aid by determining the base value and the target value to define thresholds for gauging performance.
Besides, e-commerce stores can also leverage custom visuals from marketplace templates to include extra functionality, like multi-lined charts, bullet charts, dual KPIs, and so on.
All of these features help users monitor their progress towards their objectives with ease. Plus, with built-in mobile compatibility, Power BI can provide you with reports optimized for mobile and personal alerts via a mobile app.
Klipfolio
Pricing
- Free plan: 0$/month
- Plus plan: $99/month
- Pro plan: $229/month
Custom plan: Contact the vendor for more information
Klipfolio is a visual analytics SaaS platform made with amazing connectivity and pre-designed templates, allowing users to have a dashboard or report in minutes.
This KPI tracking software features PowerMetrics that can automate manual tasks associated with tracking KPIs, such as accumulating and visualizing marketing data. It can import and consolidate data from more than 300 data sources. Plus, with MetricsHQ on the Klipfolio’s site, users can have access to over 135 metrics and KPIs, gaining important insights and examples.
Additionally, there is a native mobile app that enables mobile dashboarding and KPI tracking on the go. So convenient!
Geckoboard
Pricing
- Starter plan: $35/month or $28/month
- Team plan: $159/month or $125/month
- Team Plus plan: $275/month or $219/month
- Company plan: $599/month or $479/month
Geckoboard introduces a fresh way of working to efficiently help companies attain their goals. Uniquely, the tool is optimized for your office wall – create a TV dashboard in minutes with a drag-and-drop interface.
This KPI tracking software lets you pull KPIs from common business tools without any technical know-how. You can convert tracked data in an Excel file or Google Sheet into live visualization without making any effort.
Moreover, it’s super easy to use Geckoboard. You can flexibly resize, group, or rearrange your data visualizations and include status indicators, comparisons, and goals to show significant changes and progress against main targets.
Scoro
Pricing
- Essential plan: $28 per user/month or $26 billed annually
- Standard plan: $42 per user/month or $37 billed annually
- Pro plan: $71 per user/month or $63 billed annually
- Ultimate plan: Contact the vendor for more information
Scoro KPI tracking software will give you an overview of every aspect of your business in one or several dashboards. Hence, you can keep tabs on your project, work, and financial KPIs with ease.
The tool allows you to create custom shareable dashboards for each department in your company for a thorough summary of everyone’s goals and KPIs. Thereby, you can have an insight into how your team spends their working hours, which activities require most of their time, and which tasks can be optimized.
Grow
Pricing: Get a quote from the vendor
Grow concentrates on interactive ready-made or customizable dashboards that merchants can grasp and share through web access. Grow builds its own native mobile app, ensuring dashboards can be viewed via Android and iOS devices.
There is a wide range of KPIs targeting actionable metrics that are classified by the type of change they aim to achieve. For instance, customer engagement KPIs consist of conversion rate, bounce rate, or acquisition costs, while financial performance KPIs involve metrics like revenue forecast or return on investment.
You can discover your data via custom views, filtering by individual metrics or dashboard metrics to find the information they need. What’s more, Grow also presents KPI tracking and KPI examples for small businesses, driving results for developing companies.
KPI Fire
Pricing: Contact the vendor for more information
KPI Fire was born to simplify how you monitor the progress of your business enhancement programs.
This KPI tracking software supports aligning strategic objectives with key performance metrics and evaluating the contribution of vital projects. Besides, the tool streamlines preparation for periodic business reviews and boosts the efficacy of daily or weekly tier meetings.
Asana
Pricing
- Basic plan: $0/month
- Premium plan: $13.49 per user/month or $10.99 billed annually
- Business plan: $30.49 per user/month or $24.99 billed annually
- Enterprise plan: Contact the vendor for more information
Asana is an all-in-one project management system, enabling you to monitor conversations, tasks, projects, and dashboards.
The various projects in Asana will be monitored with their “card” system”. Within every card, you can generate mission objectives, due dates, and add members in charge of the tasks.
This KPI tracking software generates a dashboard with an array of tactical overviews, which helps you keep track of your progress across your individual projects.
Sisense
Pricing: Get a quote from the vendor
Sisense is a data analytics platform filled with a set of robust tools and beautiful dashboards, bringing you the simplest ways to obtain insights and business value from complicated data.
Users can leverage it for tracking KPIs as its dashboard update in real-time and automatically informs users if necessary. This KPI tracking software allows you to pick KPIs to follow, from time spent onboarding each customer, net profit, to revenue boost.
In addition, Sisense offers a list of industry-specific KPIs, helping e-commerce businesses access concrete insights targeted towards fields such as HR, online marketing, finance, and so on.
Conclusion
Before selecting KPI tracking software for your own company, you need to find out what features you need and start considering multiple options to compare your requirements with their features.
Depending on your business and what problems you’re tackling, you can choose the most suitable tool for tracking your KPIs and goals. Make sure you take every factor into account before pulling the trigger, or else you might waste your money for nothing.
Subscribe and follow Synodus for more upcoming blogs!
More related posts from Big data blog you shouldn’t skip: