Project Summary
| Domain | Techstacks | Service Used | Cooperation Models |
| Transportation Logistics Supply Chain And Storage | Advanced SQL Oracle Adv Power BI Power Automate Excel | – | 1 Data Analyst Dedicated |
About Our Client (*)
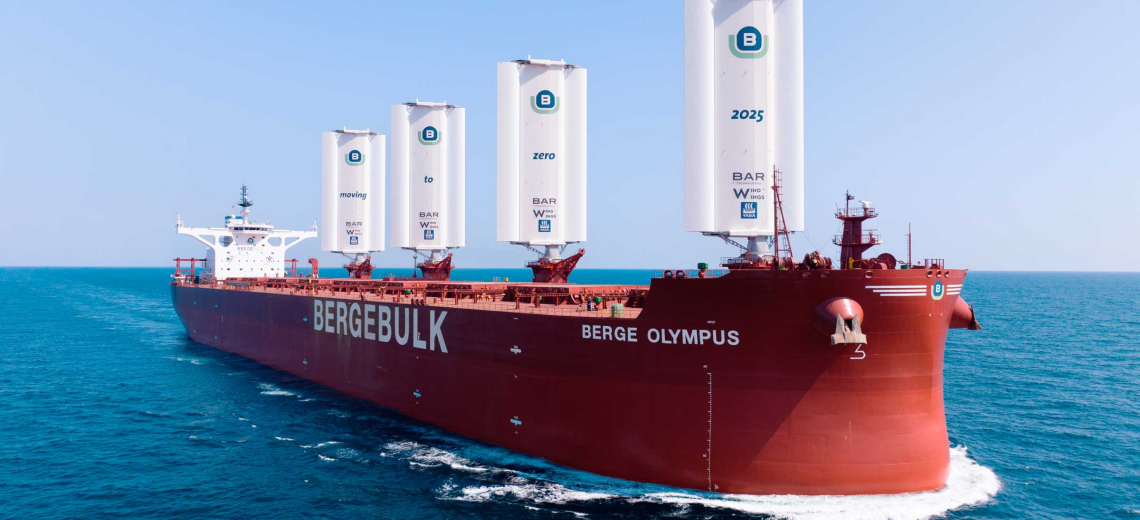
Our client is a leading dry bulk shipping company with a young and dynamic fleet of over 80 vessels, totaling more than 14 million DWT (Deadweight Tonnage). With a proven track record for safe, efficient, and sustainable delivery of commodities globally, our client is one of the most respected names in the industry, providing the brand with a strong financial foundation and a wealth of experience.
The company also has a strong focus on safety and environmental protection, and it is committed to operating its fleet in a sustainable manner.
The Challenges
Our client swiftly understood the need for change to thrive in a highly competitive and global shipping market since they had been working with slow and manual data reporting system, preventing them from managing user requests effectively, and maximizing the data potential.
- One significant challenge was the absence of a unified data source, as all information related was scattered across various systems and sources. Some data was even manually created in different formats (.csv, .xlsx) on individual computers, while the rest resided in other online sources.
- The existing reports faced multiple issues, lacking user-friendly interfaces and suffering from slow loading and download times. Furthermore, some reports were manually created, lacking automatic refresh capabilities. The absence of a request reception management system added to the challenges of effectively managing user requests.
- To quantify the situation, the average time to load automated reports on Power BI was found to be 215 seconds. While 70% of existing reports (50 reports) were automatically refreshed, 80% of employees expressed that the design of the reports hindered their effective use.
These challenges highlighted the urgent need for a comprehensive overhaul of the whole company’s data reporting and management systems to enhance efficiency and responsiveness in the competitive shipping industry.
Work With Us
And our client has been embarking on a journey of data-driven transformation towards success with the help of Synodus.
Tired of scrolling?
Download the full PDF case study for easier offline reading!
The Solutions
To address key challenges, we have approached this project with multi facets:
- Initially, we conducted extensive stakeholder interviews, collecting valuable feedback from users and decision-makers to gain a thorough understanding of their needs and expectations.
- To enhance the request process, we recommended a structured workflow, introducing a dedicated tool for managing departmental requirements. Concurrently, BI reports were developed to empower managers in tracking the progress of these requests.
- Another pivotal aspect involved systematizing manual documents. We streamlined all manual files, proposed standardized formats for each document type, organized a centralized repository, and implemented procedures for the automatic extraction of data into the database.
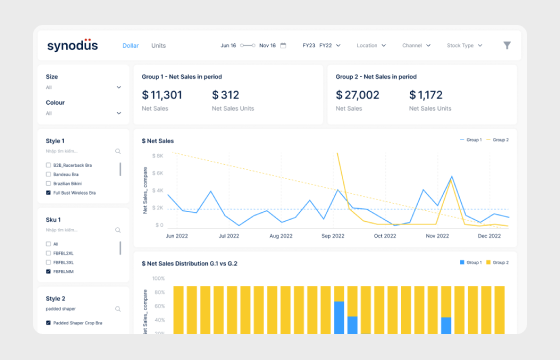
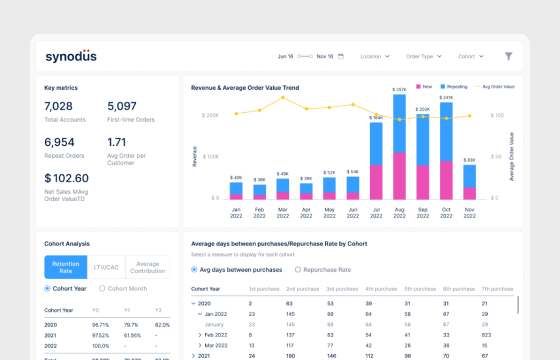
- Additionally, existing reports underwent a redesign to optimize user-friendliness. This involved adjusting interfaces and refining the data model, Data Analysis Expressions (DAX), and a diverse range of charts. Through these comprehensive initiatives, we aimed to not only address current challenges but also elevate the overall efficiency and effectiveness of the reporting and data management systems.
Results & Impacts
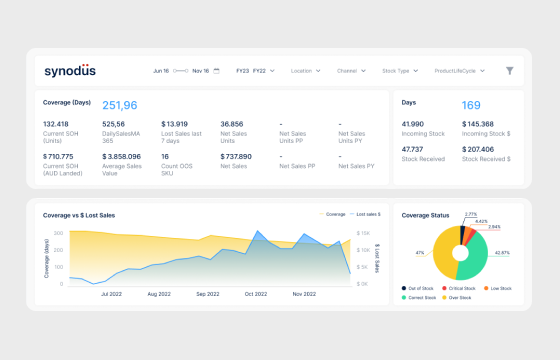
The implemented changes have significantly enhanced the report system, providing users with a user-friendly interface, meaningful indicators, and automatic refresh capabilities for an improved user experience.

This transformation enables users to find answers to critical questions, such as:
- Assessing the safety status of ships.
- Identifying vessels preparing to dock.
- Understanding the factors impacting transportation costs.
- Pinpointing what increases fuel consumption.
Additionally, the IT team expresses satisfaction with the streamlined request process, alleviating their workload burden. The average time to load former versions of reports on Power BI was 215 seconds, but now it has been reduced to just 20 seconds.
Achieving full automation, 100% of reports now refresh automatically, ensuring real-time and up-to-date information. Only a minimal 10% of employees find that the redesigned reports pose any hindrance to their effective usage, showcasing a substantial improvement in overall user satisfaction and system performance.
You can be as successful as our client!
What’s the future holds for our collaboration:
The client has chosen to extend their collaboration with us, entrusting us with an ongoing data strategy project. This initiative is specifically tailored to bolster their capabilities in demand forecasting for the various services they offer.
This continued collaboration is a testament to the success and value they’ve found in our partnership, and we are committed to delivering innovative and effective solutions that contribute to the client’s ongoing success in navigating the complexities of demand forecasting within their industry.
(*) We take our clients’ confidentiality seriously. While we have either modified names or refrained from disclosing them, the results are real.