
-
Introduction
In ecommerce and DTC, your customers have all the power. They’re armed with reliable product reviews from their peers, the ability to quickly compare prices between online stores, and the opportunity to vote with their wallets. Their expectations are high and to give them a reason to buy from you, you need to offer them the best possible online shopping experience.
No matter how you slice it, there’s only one thing that will help you do it right: data. And that’s where ecommerce analytics come in.
Data analytics is the process of collecting and analyzing large amounts of information. In e-commerce businesses, data analytics involves collecting data about consumer habits and website performance to improve the online shopping experience and increase sales. Ecommerce analytics include metrics related to the full customer journey from discovery, to acquisition, to conversion, finally to retention and advocacy.
Here is a list of 19 dashboards that cover this entire domain. It can be divided into four categories:

Ecommerce Sales:
Detailed analyses of sales performance by channel, product and time series

Inventory:
Stock on hand, stock in transit, lost sales management

Customer Insights:
Customer behaviours indentification

Product Insights:
Including important KPIs for product journey
-
Sales Dashboards
A sales dashboard is a visual sales report that enables C-level executives and managers to oversee and monitor sales KPIs in a single location effectively and thus assists teams with hitting sales targets.
Questions that Sales Dashboards enable C-level executives and sales managers to answer:
1. What are the top products that they should focus on?
2. How should they plan their inventory in the next 6 months?
3. Which sales channels are performing the best out of all channels?
4. What sales channels are performing the best out of sales records for the past year?
A business could have more than one single pain point and the dashboards should be able to give the users the needed actionable insights so that they can get it resolved. There’s no one-size-fits-all sales dashboard, so it needs to be curated every time to meet the demand of each business.
In this case, let us say the E-commerce business invested a lot in developing and marketing numerous product collections on various sales channels for the past couple of years. So now the c-level executives and sales managers are asking for dashboards that meet their needs to:
- Monitor sales of products on a daily basis
- Monitor sales accompanied by time series to see the trends and spot the outlier if any.
- What sales channel are they getting profit from the most?
- How should they plan their inventory to avoid lost sales of the top products?
- Did the introductions of their new products affect the sales of other similar products and how much was the effect?
From there, reports of Sales Monitoring, Sales by Channel and Products’ Sales Performance were born. They cover different dynamic KPIs in grouped visuals to answer these questions thoroughly, and even give additional information of related sales aspects so that the decision-makers can view sales numbers in contexts and come up with the most effective plan.
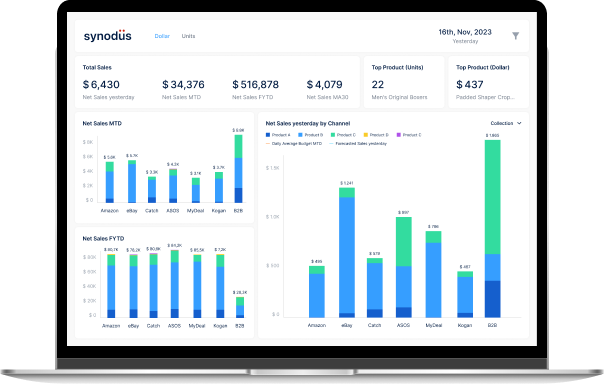
Sales-daily Monitoring
A daily sales report addresses this issue quite effectively. It can help you gain insights, pointing out bottlenecks and gaps in your sales process and your sales team can understand the challenges ahead of them and find solutions in time. This report identifies opportunities to achieve the below goals:
- Track most recent net sales status.
- Track sales channel with the best performance.
- Track product performance yesterday.
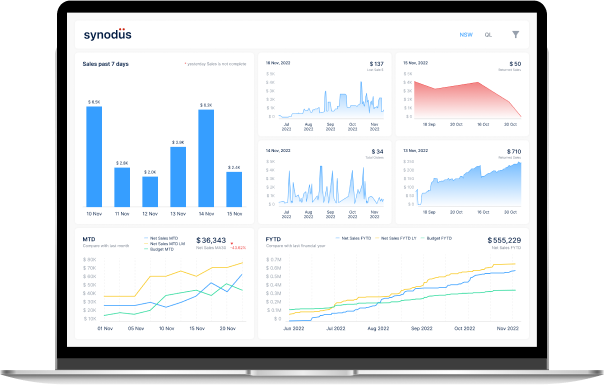
Sales Growth
The most effective use of this sales growth report will come from the context it provides, helping managers to identify patterns or trends and set realistic goals. Presenting an overview allows sales leaders to develop sales strategies and stay focused on the bigger picture-which is where they need to be. The business could achieve the below goals:
- Track the current sales trend
- Catch the seasonality in business
- Track other aspects of sales related to inventory and sales returns
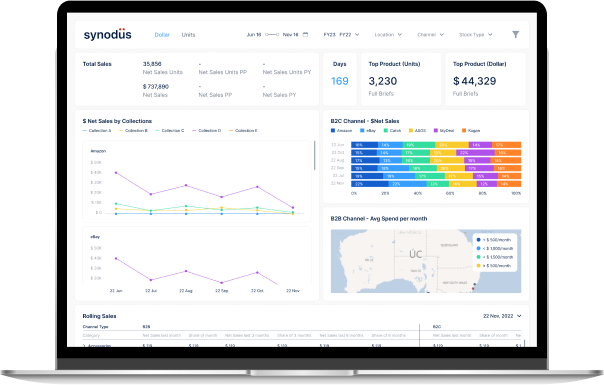
Sales by Channel
Businesses with multi-channel marketing hope to reach more than just online marketplaces. With this dashboard, users have the option to choose a channel from the dashboard to view information about that channel’s performance. The dashboards give answer to the following questions:
- Understand customer’s purchasing habits
- Inventory and marketing planning
- Assess collections’ popularity
- Track channels’ sales over periods
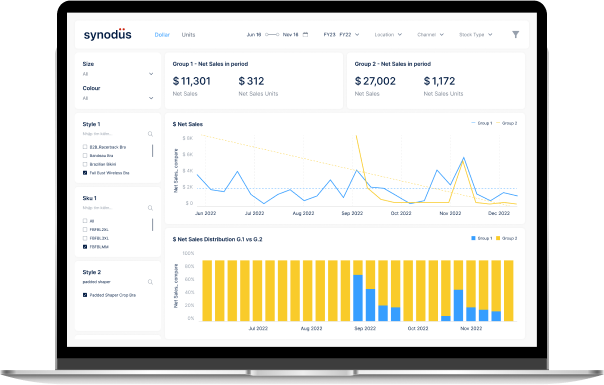
Sales Cannibalization
This report intends to analyze the “cannibalization” in business which is defined as a loss in sales caused by a company’s introduction of a new product that displaces one of its own older products. The goals of this dashboard will be:
- Monitor the impact of introducing new products
- Track the performances of products
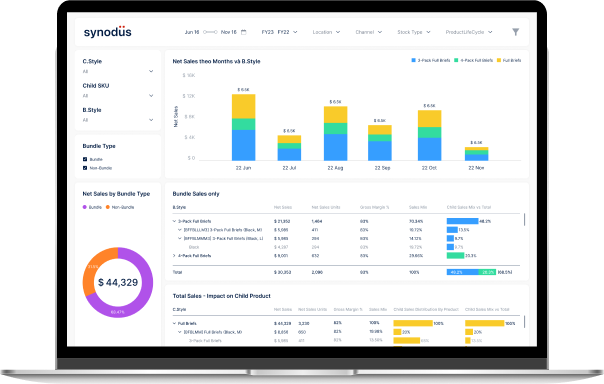
Sales Performance by Products
This report serves the purpose of tracking the performance of any particular product sold on its own and in bundles that contain it. The business can achieve the goals as following:
- Assess in which form a product is better sold
- Track a product’s detailed performance
-
Inventory Dashboards
In order to source, store, and sell inventory-both raw materials and finished goods-systematically, inventory management is used. Businesses should always have the appropriate inventory, at the right time, in the right quantity, and at the right price. This is especially true if they stock, sell, and fulfill orders across multiple locations.
In order to maximize inventory and deliver goods to clients as quickly and inexpensively as possible, they need a system that gives them visibility into stock levels across all of their sites.
Business intelligence can provide actionable information to manage and supervise purchases from suppliers and customers, keep stock inventories up to date, and execute orders. It assists users of C-levels, purchasing managers, and inventory managers in reducing inventory expenses, enhancing service standards, effectively managing inventory assets, and avoiding out-of-stock situations. To come up with the contents for the dashboard which include metrics, KPIs and different types of visualization, the analysts should first address the concerns of the aforementioned users – do they want to know the reasons for the stockouts and lost sales for the past financial year? Which locations of warehouses had the lowest GMROI and was it because of the slow-moving stocks? What are the average sales and the forecasted sales for the Out-of-Stock Items? How is the emergency stock situation at the moment and are the stocks for those SKUs in transit? Inventory dashboards typically vary from business to business, user to user and this goal to that goal – so all of these factors should be considered in the making.
Given a business that has multiple locations of warehouse and been concerned of lost sales as well as low GMROI numbers for the last year, these business needs and questions regarding inventory have been extracted:
- Monitor the status of emergency stocks
- When and how will emergency stocks be after incoming stocks arrive?
- Does the present stock level match the trend in net sales?
- How are the stocks moving between the warehouses?
- Which product category produces the highest gross margin and GMROI?
Dashboards of Stock Overall, GMROI, Stock Health and Emergency Stock & Stock In Transit are created to meet the demands.
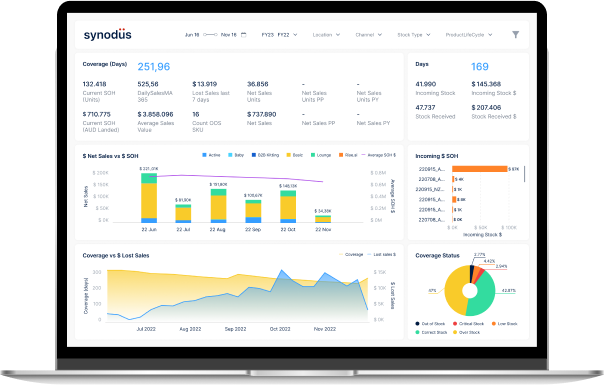
Stock & Sales Trend
The dashboard lets users monitor the overall stocks situation to see if the stocks on hand are aligned with the sales trend and if the lost sales and coverage numbers are alarming. The achievements of this dashboard:
- Inventory Management
- Prevent stockout in future
- Monitor lost sales caused by stockouts
- Track the transfers of stocks
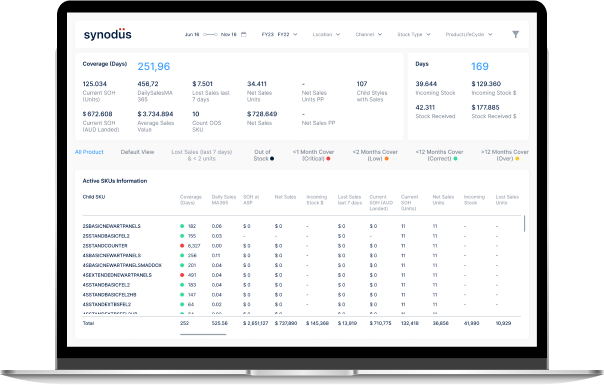
Inventory Analysis
This report dives deeper into all stock information of all SKUs and allows users to choose buttons to sort out SKUs based on their coverage status, then quickly check SKUs that has lost sales, SKUs that is out of stock, stocks being critical or low when they need to. The goal is to closely monitor the stock status of each SKU and assist inventory decision making after considering both the sales and the stocks of the product.
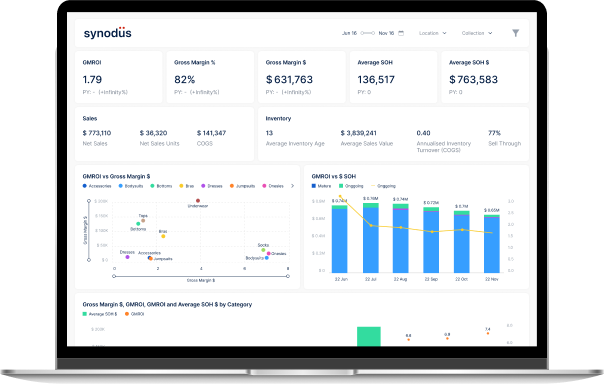
GMROI
This report is used to monitor the profitability of the investment in inventory using GMROI along with gross margin and the number of stocks on hand. This dashboard can help the business:
- Assist inventory purchase decisions
- Track outcomes of previous inventory purchase decisions
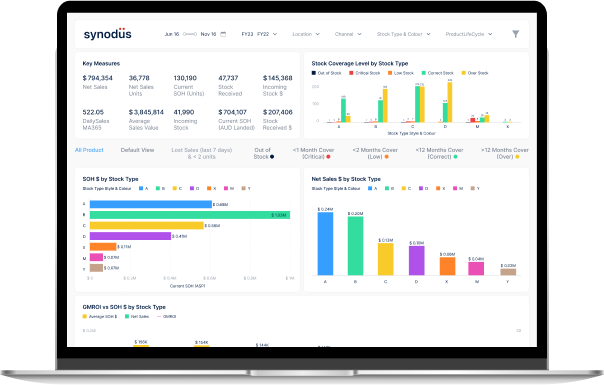
Stock Health
This dashboard breaks down stock coverage, stocks on hand value, net sales value and GMROI by stock types so that users are informed whether a stock type is healthy or not. A healthy stock type typically possesses a balanced combination of these factors. Business achievements:
- Monitor stocks on hand value by type
- Monitor net sales value by type
- Monitor stocks on hand value, net sales value and GMROI by type
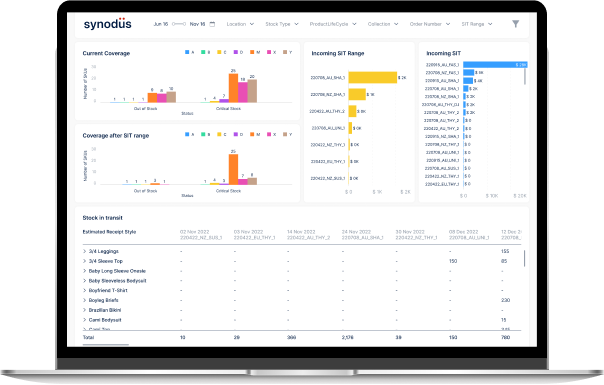
Emergency Stock & Stock in Transit
The report focuses on emergency stocks – products out-of-stock or being listed as critical – and stocks in transit, with the goal is to prevent stockouts which eventually will cause lost sales, to track incoming stocks and to make decisions of placing purchase orders to meet the demand. This dashboard can help the business:
- Foresee the stock status after the date range
- Monitor stocks incoming
- Monitor SIT for all styles
-
Customer Insights Dashboards
Without a constant flow of contented and happy consumers, no firm can succeed. Better customer service results from understanding their demands. Customer insights dashboards track the current pattern of customer acquisition, retention, and churn rates as well as other customer segmentation options. It might be used to develop strategies that would increase revenue and profits by lowering acquisition costs, boosting retention rates, and offering more efficient and effective customer service.
The dashboard answers the below questions:
1. How many customers purchase, churn, and return over time?
2. How to group customers and act with each customer segmentation?
3. What is the ratio of Customer Lifetime Value to Acquisition Cost?
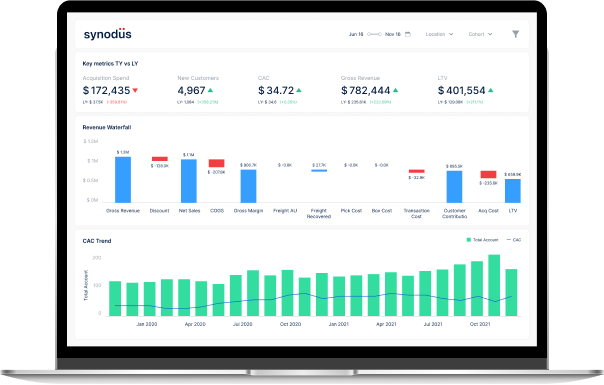
Customer Performance Overview
Once a business begins investing more in sales and marketing, management should ensure CAC does not rise to an unacceptable level. This report identifies opportunities to achieve the below goals:
- Track cash flow
- Track total accounts, new accounts
- Track marketing effort
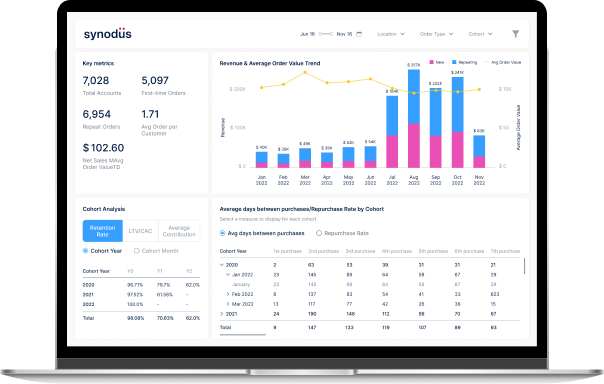
Customer Trend
Companies use cohort analysis to analyze customer behavior across the life cycle of each customer. The business could achieve the below goals based on Customer Trend report:
- Track revenue & average order value of new/repeating orders
- Track percentage of customers are still active after a period of time
- Track customer contribution over time
- Track customer repurchase intention over order
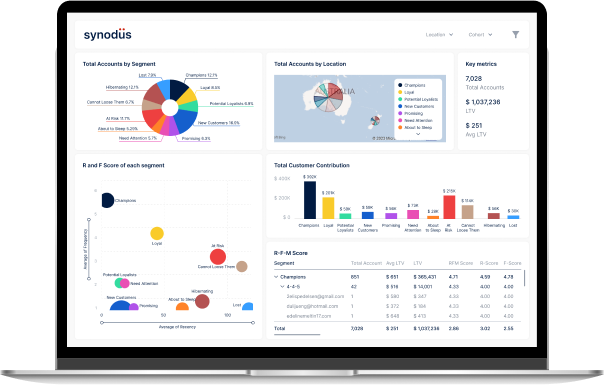
Customer Segmentation
Understanding who your customers are and what they want is a fundamental part of any successful business. Yet as a business grows, so does the customer base, and it can become increasingly challenging to create a one-size-fits-all customer profile. This is where the concept of customer segmentation comes in.
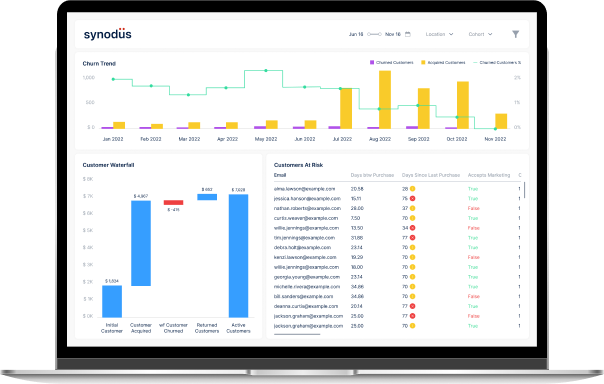
Customer Churn Risk
Companies that rely on recurring revenue face particular difficulties in analyzing customer turnover and retaining customers. This report for customer churn analysis offers analysis of customer growth and churn based on behavior by answering the below questions:
1. What is the current churn rate?
2. How does the number of initial customers and customers who are still active change over time?
3. Who is likely to leave in the near future?
-
Product Insights Dashboards
Product ratings influence E-commerce purchases. Understanding what products customers like, and what they are likely to purchase helps in planning future strategies. Identifying top profitable products, top profitable bundles, top non-performing products help in realizing what works and what does not. The dashboard answers the below questions:
1. What is the difference of product performance between first-time orders and repeat orders?
2. Which are the hero products?
3. Why do customers return goods? Does this have a big impact on sales?
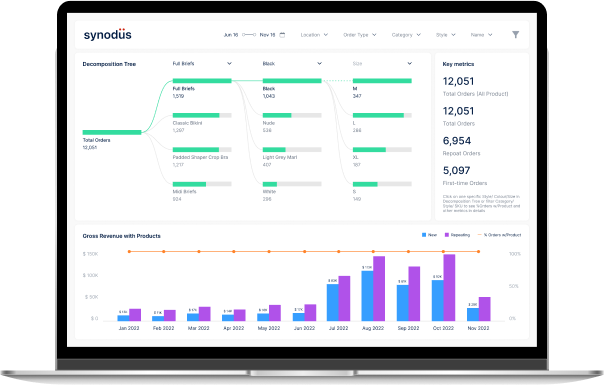
Products in Orders
This report includes the basic KPIs important from a sales perspective – total orders and gross revenue. It identifies opportunities to achieve the below goals:
- Track the current sales situation
- Track the top-selling items
- Track Revenue growth
- Compare New and Repeating Orders
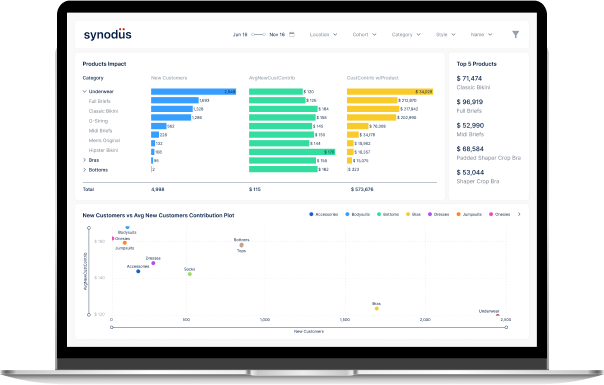
Hero Products
This report displays the statistics regarding the most popular and highly purchased products. We can see which products are doing well, so we can run advertising programs and manage imports better. The business could achieve the below goals:
- Track top-selling items on the first order
- Track customers contribution on their first orders
- See the relationship between New Customers and Average New Customers Contribution
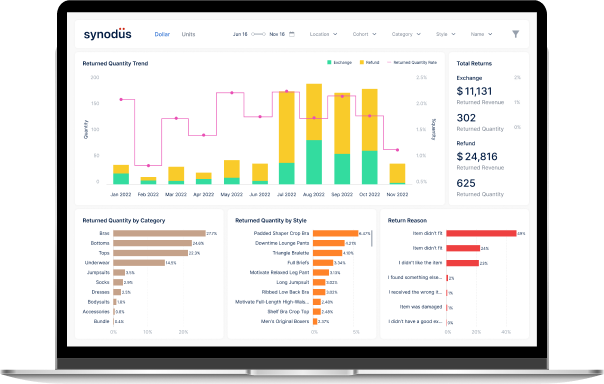
Product Returns
This report gives a visual representation of your product return data and displays it in an easy-to-understand form. The business could achieve the below goals:
- Track returned product rate
- Frequently returned products
- Common return reasons
- Preferred methods for returning products
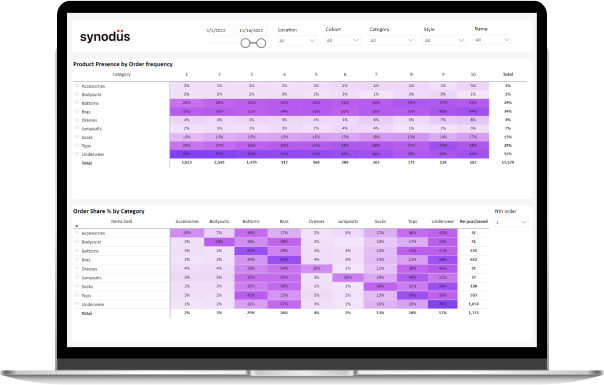
Product Distribution on First 10 Orders
The dashboard shows product performance in the first 10 orders each customer purchased. We can see the customer’s behavior towards the product through the orders. The dashboard answers the below questions:
1. What products do customers tend to buy in the next order?
2. Which product type will prevail in 1st, 2nd,… order?
3. How will the product transfer through each order?
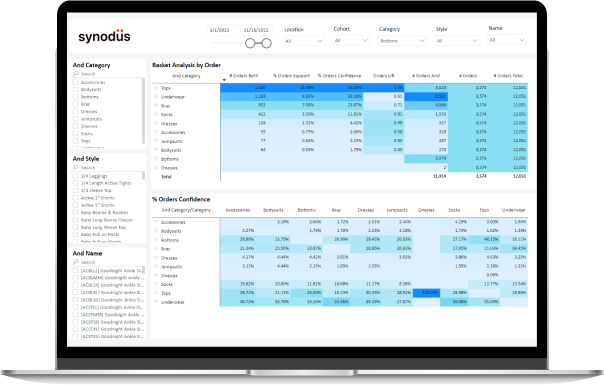
Product Pairs
This dashboard monitors the current performance of product pairs and identifies which pair of products is doing well. Thereby the marketing team can build a campaign to promote these two products together, which helps in increasing revenues and profits. The dashboard answers the below questions:
1. What types of products are often purchased together?
2. What is the best product pair?
3. Which product pairs should be implemented marketing campaign?