Once a business begins investing more in sales and marketing, management should ensure CAC does not rise to an unacceptable level. They should also pay close attention to customer attrition to make sure that new batches of customers are a good fit for the product/service and do not have a higher attrition rate than existing customers. If CAC, CLV, or customer attrition gets out of line, it’s time to stop and reassess the marketing channels and strategy. This report identifies opportunities to achieve the below goals:
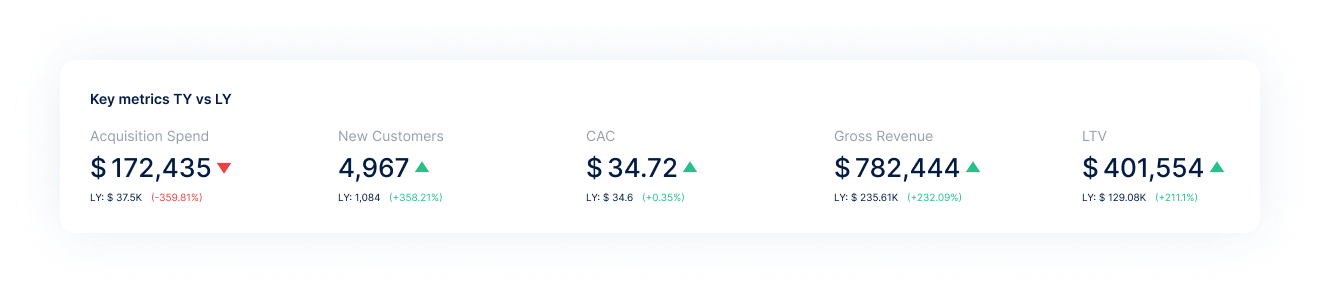
The quick indicator view boxes at the top of the report make it easy for businesses to track the numbers they need. It can even be compared with the previous year to see if the situation is better or worse.
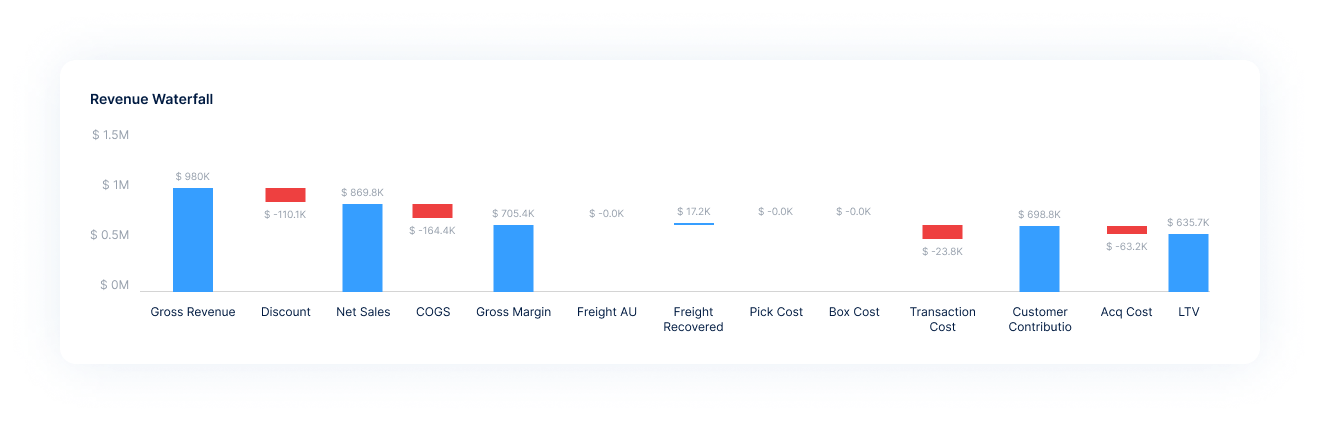
The waterfall chart shows a running total as values are added or subtracted. It’s useful for understanding how an initial value is affected by a series of positive and negative values. The columns are color coded so you can quickly tell positive from negative numbers. In this report, after deducting other expenses and losses from Gross Revenue, we obtain Customer Lifetime Value. Looking at revenue and expenses like this allows businesses to realize where they are doing well, whether they are over budgeted or not so they can adjust to fit their budget.
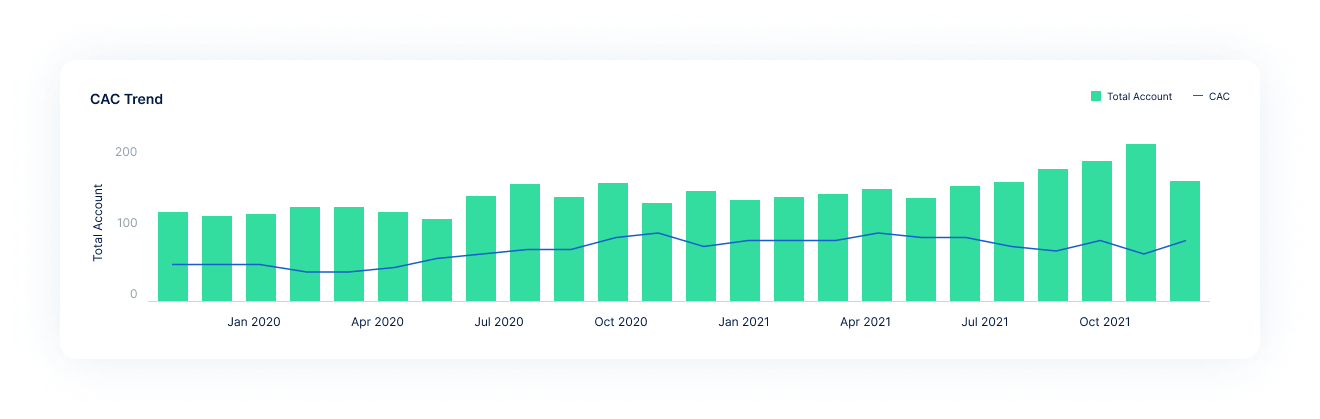
Finally, the ‘CAC Trend’ chart lets us compare the overall number of new accounts with the expense of acquiring new customers. Previously, it spent $40 CAC but received relatively few new accounts; but, recently, with the same $40, it received ten times as many new customers as in the last period. Businesses must reflect on why this is the case. Is it as a result of the occasionally carried out sales and promotional activities. The budget should then be divided correctly for each subsequent period.
Conclusion
This report allows you to track how your ecommerce business is performing and demonstrate the value of your online marketing efforts for the business.
Get a fully-stacked data team within 47 hours without making a hire. Our team of data experts help build your data infrastructure, create your metrics and much more. Available from day 1, so you can get a world-class data setup in record time.