The dashboard shows product performance in the first 10 orders each customer purchased. We can see the customer’s behavior towards the product through the orders. The dashboard answers the below questions:
1. What products do customers tend to buy in the next order?
2. Which product type will prevail in 1st, 2nd,… order?
3. How will the product transfer through each order?
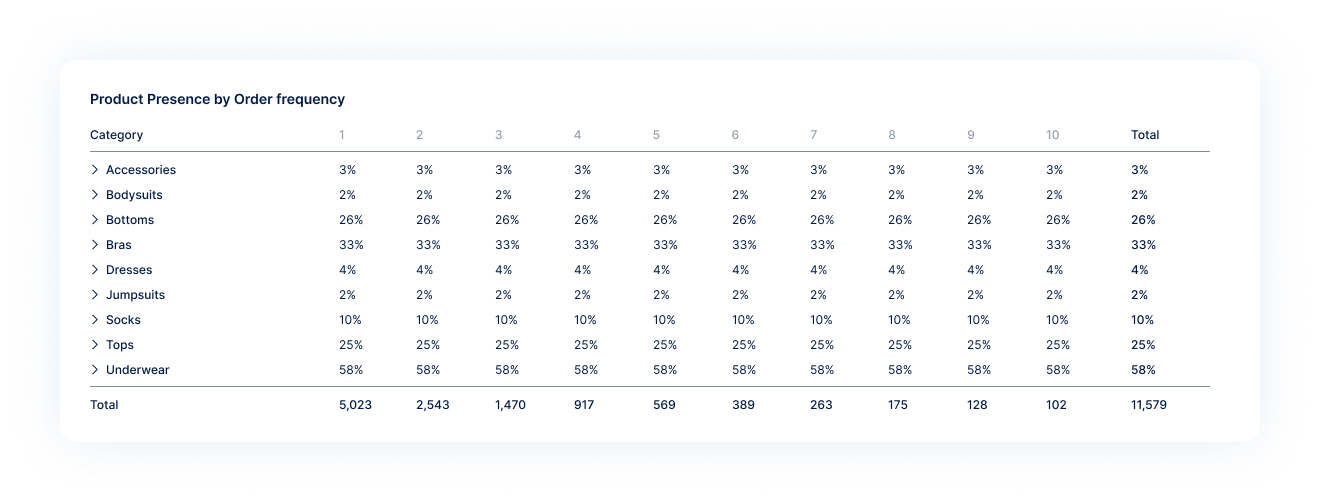
Customers first have a tendency to purchase underwear items while accessing the company’s products, which is its primary product category. Up to 56% of the initial orders included Underwear, and 33% of them included Bras; these percentages also marginally increased on the second order. Customers did, however, eventually start trying other items including Tops, Bottoms, and Dresses in their subsequent orders. Hence, after recognizing trends, we can provide discounts and coupons for Tops, Bottoms, and Dresses products based on the quantity of prior purchases made by customers and the items in their cart. Businesses can boost sales and profitability by identifying the ideal customer behavior.
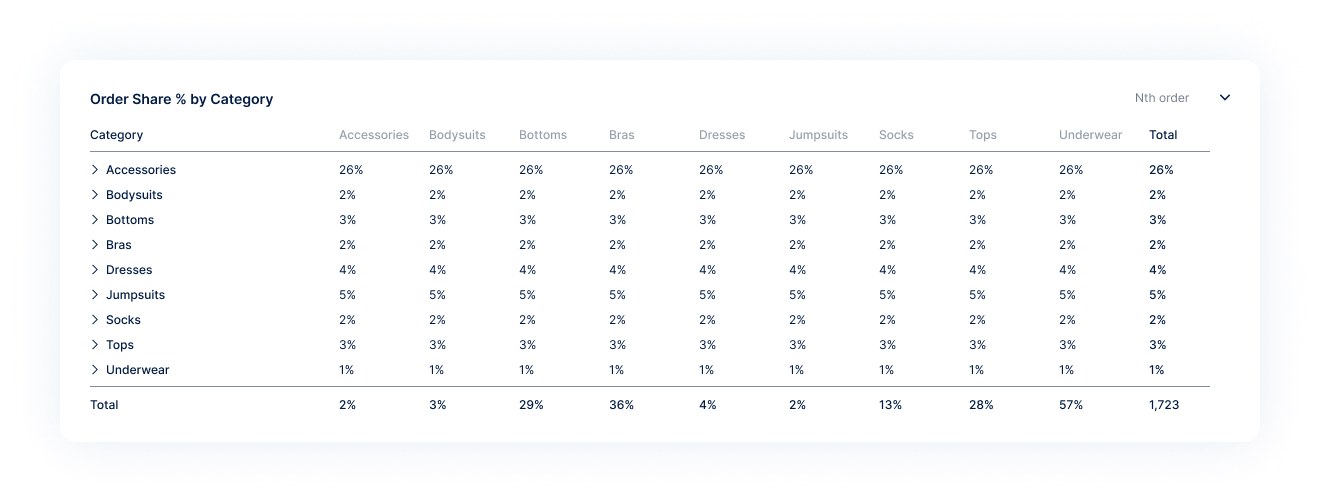
Order Share % by Category
Which items will predominate purchase orders and the general movement of the categories were shown in the ‘Product Presence by Order frequency’ matrix above. What if we would like to see more specifics about each category? This is what the matrix “Order Share% by Category” will enable us to do.
If customers purchase Underwear on their first order, 76% of them will do so again on their subsequent orders, according to the matrix. Dark diagonal line also shows that customers are more likely to acquire goods they have already purchased, whether as a result of a positive experience with a used item or a hesitation to try a brand-new one. Due to the fact that we are now deeper in the customer’s shopping basket, business can then provide even better deals than the standard offer given before.
Conclusion
Customer behavior analytics allows any business to accurately answer all these questions and increase the probability of making a sale. By analyzing customer behaviors, you can predict what products they want, determine purchasing ability, set up your marketing campaign.
Get a fully-stacked data team within 47 hours without making a hire. Our team of data experts help build your data infrastructure, create your metrics and much more. Available from day 1, so you can get a world-class data setup in record time.