
-
Customer Trend
Companies use cohort analysis to analyze customer behavior across the life cycle of each customer. In the absence of cohort analysis, businesses may experience difficulties in understanding the life cycle that each customer goes through over a given timeframe. Businesses use cohort analysis to understand the trends and patterns of customers over time and to tailor their offers of products and services to the identified cohorts.
Once the business sees trends in how different cohorts use its products, it can identify problems in its marketing techniques and determine when and how to best communicate with different groups or types of customers. The business also uses the broken-down data to design incentives that will motivate customers to keep using their products when they are likely to stop purchasing the products.
The business could achieve the below goals based on Customer Trend report:
- Track revenue & average order value of new/repeating orders
- Track percentage of customers are still active after a period of time
- Track customer contribution over time
- Track customer repurchase intention over order
| Goals | Questions to ask | Dashboard views |
| Track revenue & average order value of new/repeating orders | How much did customers spend each time they place an order and all orders? How much did customers spend each time they place an order and all orders? | Gross Revenue, Avg Order Value |
| Track percentage of customers are still active after a period of time | How many people who’ve purchased your products once before will decide to buy from you again? | Retention Rate |
| Track customer contribution over time | What is the real contribution made by customers after deducting expenses? | LTV/CAC ratio, Average Contribution |
| Track customer repurchase intention over order | What is the customer repurchase rate? On average, how many days will they come back? | Average Days Between Purchases, Repurchase Rate |
*Key Terms
Avg Order Value:
The average dollar amount customers spend each time an order is placed on your ecommerce website
Retention Rate:
A metric that calculates the percentage of users who continue using your product or service over a given time period.
LTV/CAC ratio (Customer Lifetime Value to Customer Acquisition Cost):
Measures the relationship between the lifetime value of a customer and the cost of acquiring that customer. LTV/CAC is a signal of profitability. This metric tells you if the lifetime value of a customer is higher or lower than the marketing and sales costs to acquire that customer.
Average Contribution:
The Average Customer Contribution per year/month.
Average Days Between Purchases:
The average days between customers’ orders
Repurchase Rate:
Also known as repeat purchase rate is the percentage of customers who have purchased more than once in a time period.
Customer Trend Report
Businesses can track Gross Revenue and Customer Contribution over time to see which periods sell the most. Looking at the report, we can see that in the second half of the year, the revenue increased many times compared to the first half of the year. This can be explained by 2 reasons: customers often have a habit of not spending much at the beginning of the year and since the beginning of July, the marketing team has run promotional programs related to discounts, free socks for pack orders,… We can see that the CAC in this period is also higher than in the first 6 months of the year. Although total revenue increased, the Average Order Value did not change significantly.
Business can also recognize patterns and changes in consumer behavior with the aid of Cohort Analysis. It provides information on customer behavior, including when they leave, when they buy more, and the existing marketing methods are effective or not.
Cohort Analysis
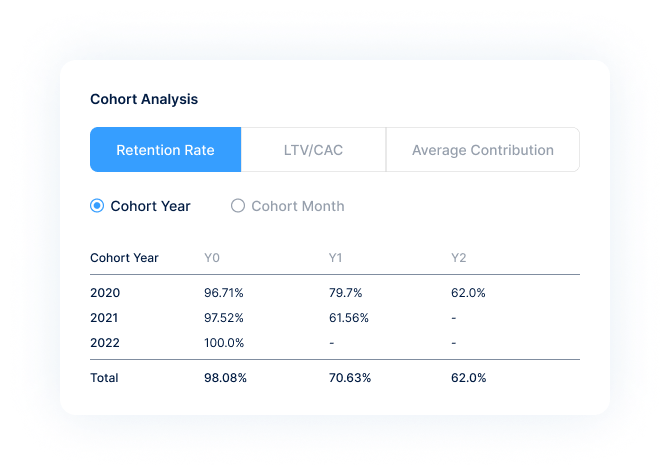
Cohort year here represents the year that the customer created a purchase account, 2020 is the first year of sales, after 1 year, 2 years, how many people will still purchase? What will the LTV/CAC and Average Contribution of these customers be?
Looking at the matrix vertically and horizontally:
Rows 2020 → 2022: New customers who made their first purchase that year, then purchased in subsequent years
Columns Y0 → Y2: Show the maturity of the customer over time (line 2020: Y0 is 2020, Y1 is 2021, Y2 is 2022… – and similar to Cohort Month)
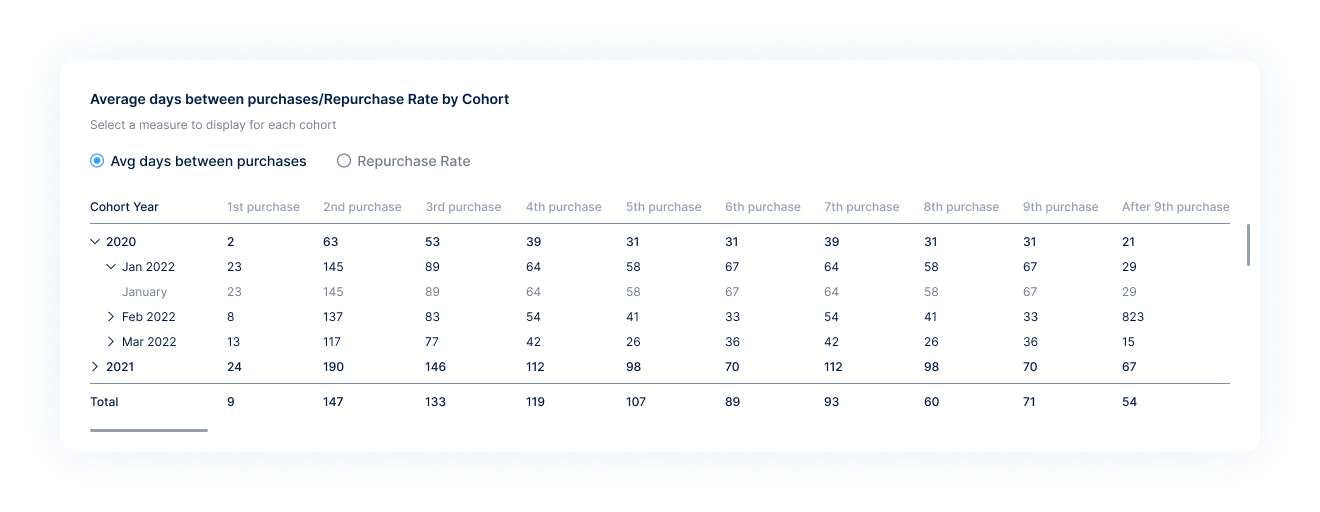
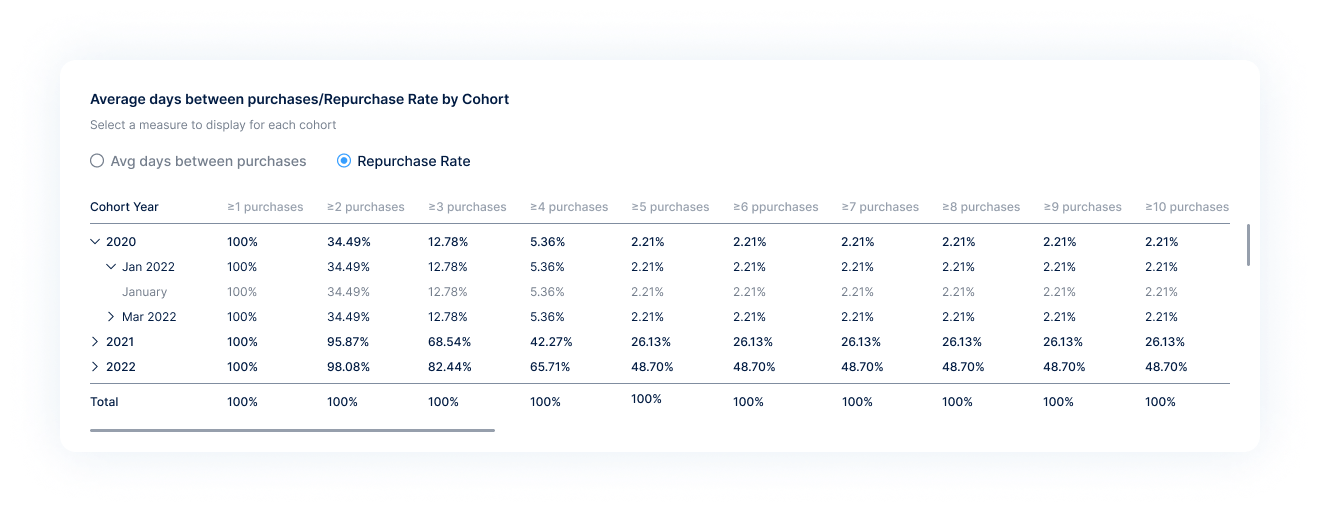
Average Days Between Purchases /Repurchase Rate by Cohort
Cohort Avg days between purchases: Of the customers who joined that year, on average, how many days it takes for the customer to make a decision to buy the next order.
Cohort Repurchase Rate: Of the customers who joined that year, what percentage of people come back to buy the next order.
Conclusion
The way your customers interact with your brand and products changes all the time—so you need to spot, predict, and react to changes fast to create customer delight. Customer trend analytics lets you better understand your buyers to improve their product experience and boost customer satisfaction and revenue alike.