Companies that rely on recurring revenue face particular difficulties in analyzing customer turnover and retaining customers. This complexity may be caused by a variety of factors, such as transaction records being added only for purchases and not for cancellations, historical measurement capturing users who have not yet had the opportunity to repurchase, or different repurchase cadences necessitating independent measurement. 

This can mean a completely different approach from their brick and mortar competitors in terms of data modeling and formulation. This report for customer churn analysis offers analysis of customer growth and churn based on behavior by answering the below questions: 

1. What is the current churn rate?

2. How does the number of initial customers and customers who is still active change over time?

3. Who are likely to leave in the near future?

What is the current churn rate?

  • Dashboard view: Churn Trend
  • Comparing a company’s customer retention performance to that of other businesses in the same industry and its competitors’ customer turnover rates can be helpful. It is crucial for a business to have a low churn rate since a high churn rate indicates high attrition, necessitating the expenditure of money to acquire new customers in order to fill the void left by departing customers. Because the churn rate affects a company’s profitability and growth, it is crucial to comprehend it. Looking at the chart, we can compare the number of customers churned with the number of customers acquired as well as the churn rate. In which the churn rate is calculated as follows:

How does the number of initial customers and customers who is still active change over time?

  • Dashboard view: Customer Waterfall
  • The waterfall chart shows a running total as values are added or subtracted. It’s useful for understanding how an initial value is affected by a series of positive and negative values. The columns are color coded so you can quickly tell positive from negative numbers. In this case we have the calculation: Initial Customers + Acquired Customers – Churned Customers + Returned Customers = Active Customers. This change can be easily tracked over time with the Time Frame slicer.

Who are likely to leave in the near future?

  • Dashboard view: Customers At Risk
  • While calculating churned customers, the product line that the company sells must be taken into consideration. Since this is underclothing, the life cycle is quite short. To identify whether a customer is about to leave, we shall compute the ratio:

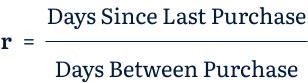
If this ratio > 2, the customer is in At Risk status. Icon is the ratio < 3 and icon is the ratio >= 3. If these customers accept marketing email or other forms of notification, sales and marketing team need to send an email or reminder message. This most likely contributes to turning Churned Customers into Returned Customers.

Conclusion

Using Customer Churn Analysis, business could minimize churn and identify potential causes of customer loss. 

Search here...

Search here...

Synodus

Get a fully-stacked data team within 47 hours without making a hire. Our team of data experts help build your data infrastructure, create your metrics and much more. Available from day 1, so you can get a world-class data setup in record time.

Contact Us

Synodus