This dashboard monitors the current performance of product pairs and identifies which pair of products is doing well. Thereby the marketing team can build a campaign to promote these two products together, which helps in increasing revenues and profits. The dashboard answers the below questions:
1. What types of products are often purchased together?
2. What is the best product pair?
3. Which product pairs should be implemented marketing campaign?
The Basket analysis pattern builds on a specific application of the Survey pattern. The goal of Basket analysis is to analyze relationships between events. A typical example is to analyze which products are frequently purchased together. This means they are in the same “basket”, hence the name of this pattern.
Two products are related when they are present in the same basket. In other words, the event granularity is the purchase of a product. The basket can be the most intuitive, like a sales order; but the basket can also be a customer; In that case, products are related if they are purchased by the same customer, albeit across different orders.
Defining association rules metrics
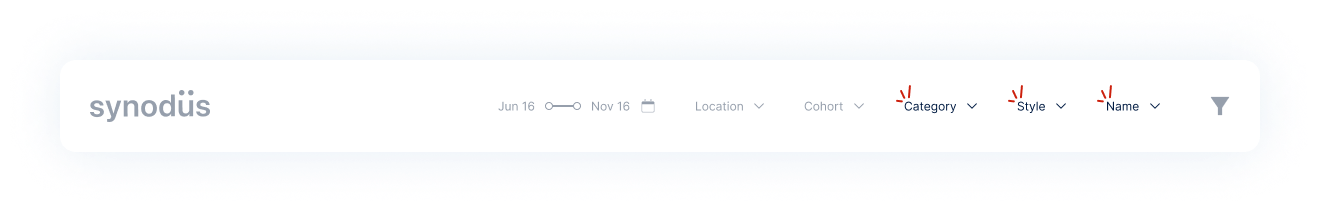
Because the pattern is about checking when there is a relationship between two products, we will call Product (Category/Style/SKU) the original viewed product and And Product (And Category/And Style/And SKU) the co-viewed product. Click on any category in the Category slicer, for example we choose “Underwear”:
# Orders
The # Orders measure returns the number of unique baskets in the current filter context. It shows you how many orders contain at least one product of the selected Category. In this case, there are 9246 orders containing at least one product from the “Underwear” category.
# Orders And
The # Orders And returns the number of unique baskets containing products of the And Product selection, ignore the Product selection in the current filter context. There are 5553 orders containing at least one product from the “Bras” category, 5456 orders containing at least one product from the “Tops” category and so on. containing at least one product from the “Underwear” category.
# Orders Total
# Orders Total returns the total number of baskets and ignore any filter over Product and And Product. That means we have a total of 16928 unique orders. one product from the “Underwear” category.
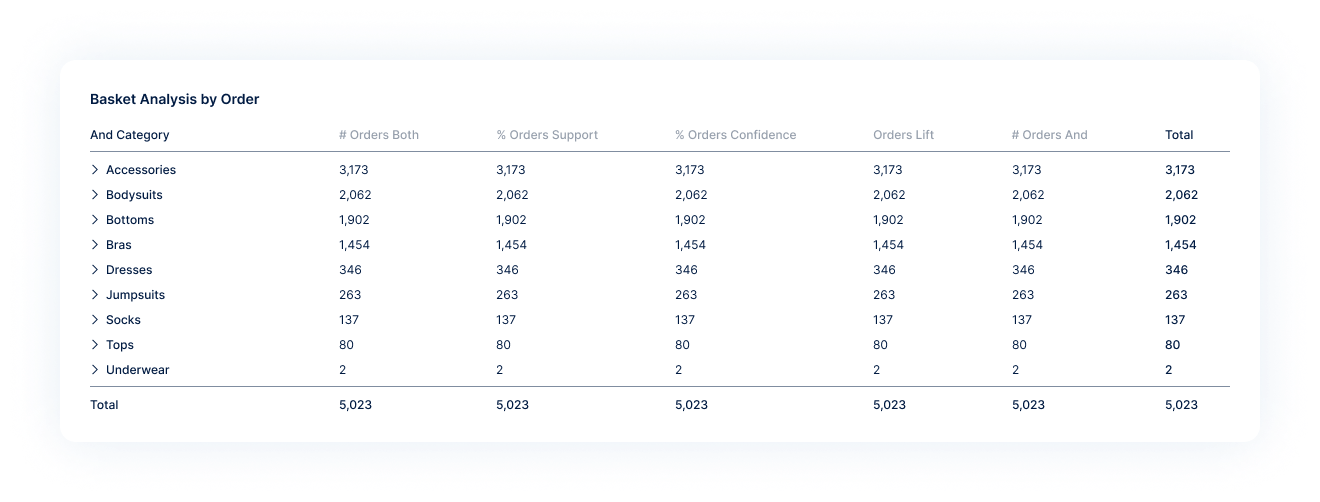
# Orders Both
# Orders Both returns the number of unique baskets containing products from both the categories selected with the slicers. It shows that 3173 orders contain products from both categories: “Underwear” and “Bras”.
% Orders Support
% Orders Support returns the support of the association rule. Support is the ratio between # Orders Both and # Orders Total. It shows that 18.74% of the orders contain products from both categories: “Underwear” and “Bras”.
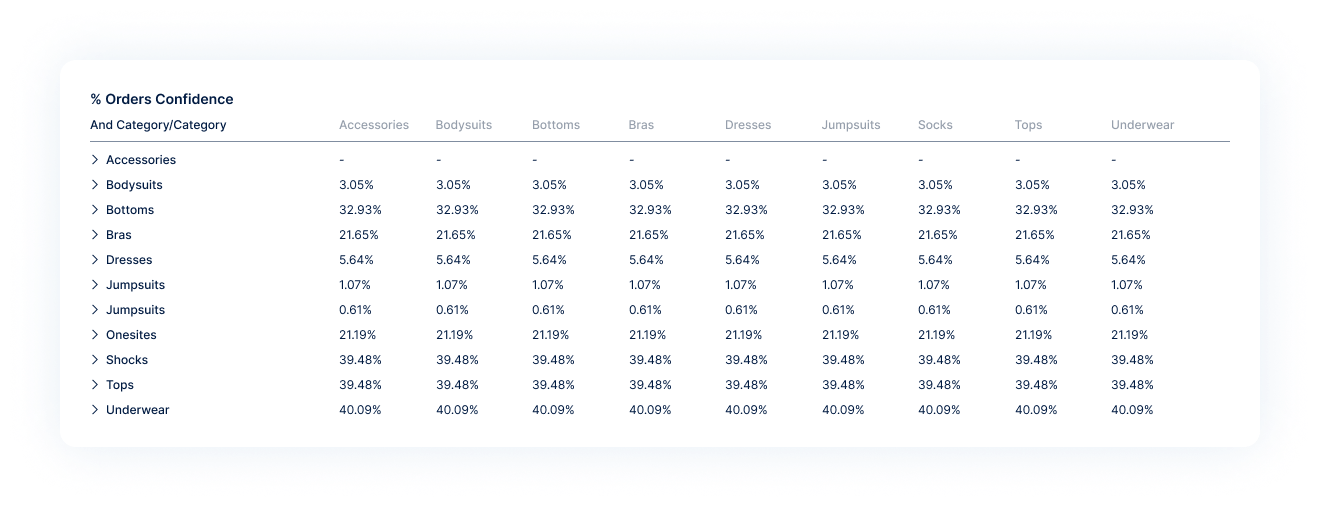
% Orders Confidence
% Orders Confidence returns the confidence of the association rule. Confidence is the ratio between # Orders Both and # Orders. It shows that out of all the orders containing “Underwear”, 34.32% also contain “Bras” products.
Orders Lift
Orders Lift returns the ratio of confidence to the probability of the selection in And Product.
A lift greater than 1 indicates an association rule which is good enough to predict events. The greater the lift, the stronger the association. It reports that the association rule between “Underwear” and “Bras” is 1.05, obtained by dividing the % Orders Confidence (34.32%) by the probability of # Orders And over # Orders Total (5553/16928 = 32.8%).
Product Pairs Report
Looking at the % Orders Confidence matrix, we can see that customers buying “Bras” are likely to buy “Underwear” too (confidence is 57.14%), whereas only 34.32% of customers buying “Underwear” also buy “Bras”.
After identifying the relationship between these two categories, we can choose the Style, And Style, Name, And Name (color/size) to see the metrics on specific products. Based on that, a Marketing campaign to promote those two products together will be conducted.
Conclusion
The dashboard gives a detailed view of these measures from product pairs and make it easy for the Sales – Marketing team to take decisions.
Get a fully-stacked data team within 47 hours without making a hire. Our team of data experts help build your data infrastructure, create your metrics and much more. Available from day 1, so you can get a world-class data setup in record time.