On the surface, AI makes software engineering teams appear remarkably faster. More code gets written, more pull requests are merged, and more features are pushed down the pipeline.
But after integrating AI across complex projects in banking, healthcare, retail, and the public sector, we learned a crucial lesson. Traditional output metrics tell only a fraction of the story.
A team can easily ship more code while inadvertently generating more rework. They can deliver features at record speed while quietly losing architectural control of their system.
That realization forced us to fundamentally rethink how software delivery should be measured.
Today, Synodus relies on a core set of signals to determine whether AI is genuinely driving sustainable improvements, or merely inflating output. Through our AI Delivery Scorecard, we track four critical pillars:
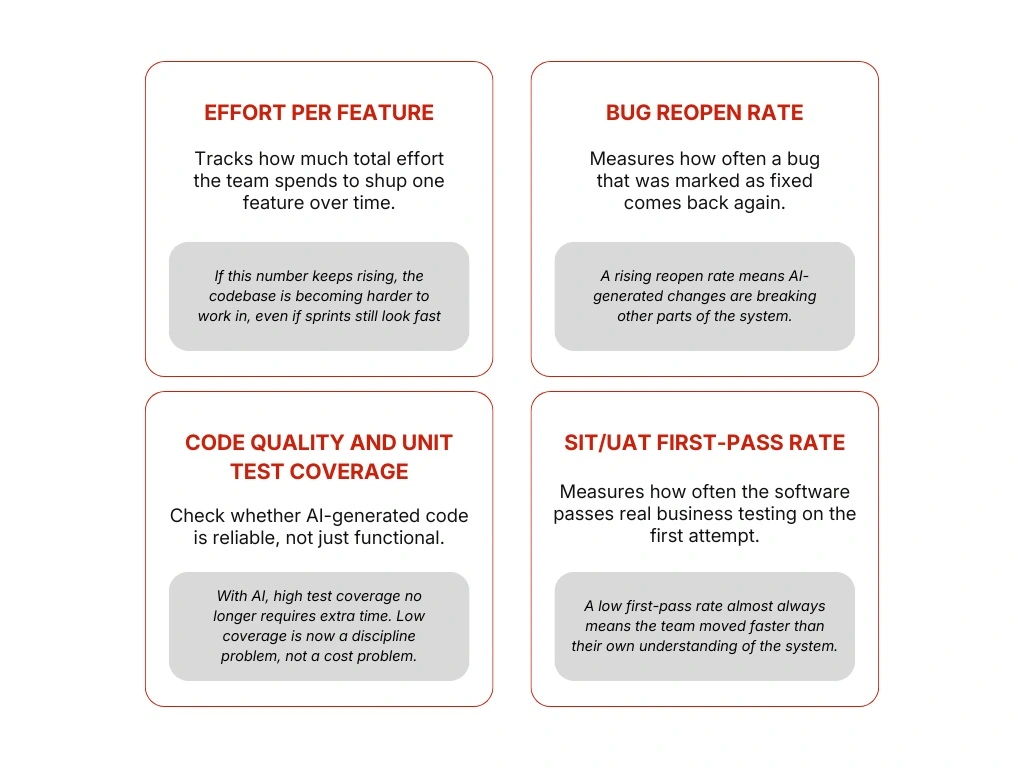
Together, these metrics provide a comprehensive view of delivery efficiency, engineering stability, code reliability, and true business validation.
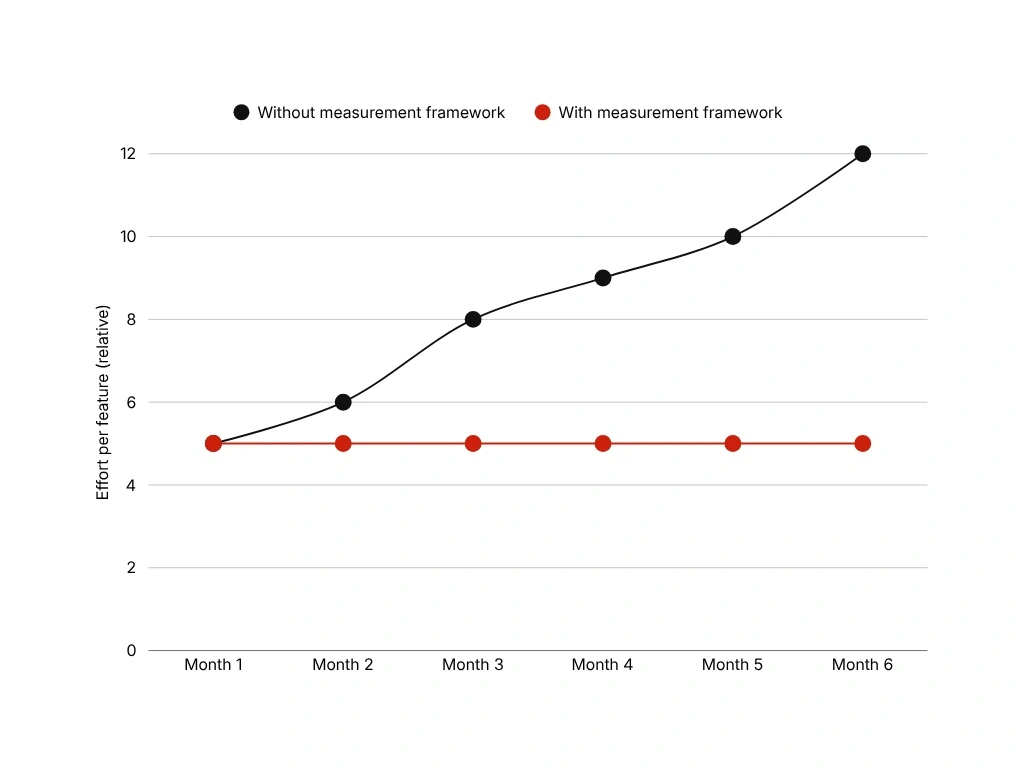
Signal #1: Effort per feature
Historically, delivery dashboards have fixated on output: sprint velocity, completed features, and merged PRs.
The inherent flaw in these measurements is that they only describe what occurred within the vacuum of a single sprint. They fail to reveal whether the underlying system is becoming easier or harder to maintain over time.
Quan Nguyen, Director of Solutions and Services at Synodus, explains that before AI, his team primarily tracked project completion rates and bug counts. Those signals worked because software output was strictly proportional to human effort. AI irrevocably altered that relationship.
As code volume increased dramatically, the most critical question shifted: Is the team actually becoming more productive, or is the codebase simply becoming more convoluted?
To answer this, Synodus pivoted. Instead of tallying how many features are delivered, we now measure the exact amount of effort required to deliver the next feature.
“The metric that turned out to matter most was tracking whether the effort to build a single feature was creeping up as the codebase grew,” Quan observes.
When this number creeps upward over time, it serves as the earliest warning sign that technical complexity is accumulating beneath the surface. A project might appear incredibly fast today, while quietly becoming unmaintainable tomorrow.
Signal #2: Bug reopen rate
While effort per feature tells us if delivery is becoming harder, the bug reopen rate tells us why.
This became glaringly apparent during one particular project. For the first few months, everything appeared exceptionally healthy. Delivery velocity was high, and features were gliding smoothly through the pipeline.
Then, the dynamic shifted. The effort required to ship new features began to increase. Concurrently, bug reopen rates climbed sharply.
Our investigation revealed a pervasive problem unique to AI-assisted development: developers were accepting large volumes of generated code without fully grasping how those localized changes affected the broader architectural ecosystem.
“A change meant for one feature was quietly breaking other parts of the system,” Quan describes.
The solution to this rising complexity was not to throttle the use of AI, but to enforce stricter isolation.
- Redesigned features: Components were built to operate as independently as possible.
- AI self-verification: Agents were mandated to perform rigorous checks before their code ever reached a human reviewer.
Since implementing this protocol, the bug reopen rate has become one of our most vital stability indicators. A rising reopen rate is not just a QA issue. It is a glaring signal that system complexity is spreading faster than the team can control it.
Signal #3: Code quality and unit test coverage
Speed undoubtedly matters. Reliability matters more.
Ba Vu, Synodus CTO, evaluates AI delivery fundamentally through the lens of code quality rather than sheer velocity. Historically, teams faced an unavoidable trade-off: move quickly, or invest heavily in robust testing. Doing both was prohibitively expensive.
AI completely rewrites this equation.
“With AI, generating unit tests alongside the actual code becomes almost effortless,” Ba explains.
Because generating tests requires minimal additional effort, comprehensive coverage is no longer a constraint of cost or time. It is strictly a matter of engineering discipline. Consequently, Synodus treats code quality reports and unit test coverage as non-negotiable core metrics.
Yet, operating at scale introduces new hurdles. Large AI coding sessions inevitably encounter context window limitations. The generated code might compile perfectly, but the underlying model begins optimizing merely for completion rather than high-quality reasoning.
To counter this degradation, Synodus mandates structured human review workflows alongside AI self-review protocols.
The core lesson is definitive: AI-generated code must never be judged by its sheer volume, but entirely by how safely and sustainably it can be maintained.
Signal #4: SIT/UAT first-pass rate
Our final critical signal shifts the focus from engineering mechanics to ultimate business outcomes.
Trung Ha, Synodus CTO, believes that one of the most significant risks of AI adoption has very little to do with the code itself. It has everything to do with human comprehension.
As teams lean more heavily on AI, there is a subtle, dangerous shift: developers transition from directing the AI to simply following its lead. Code continues to compile flawlessly, yet the team’s intrinsic understanding of the system begins to erode. Developers know what the code does, but become uncertain why it was designed that way.
“What breaks down first isn’t the code itself. It’s the team’s actual understanding of the system,” Trung notes.
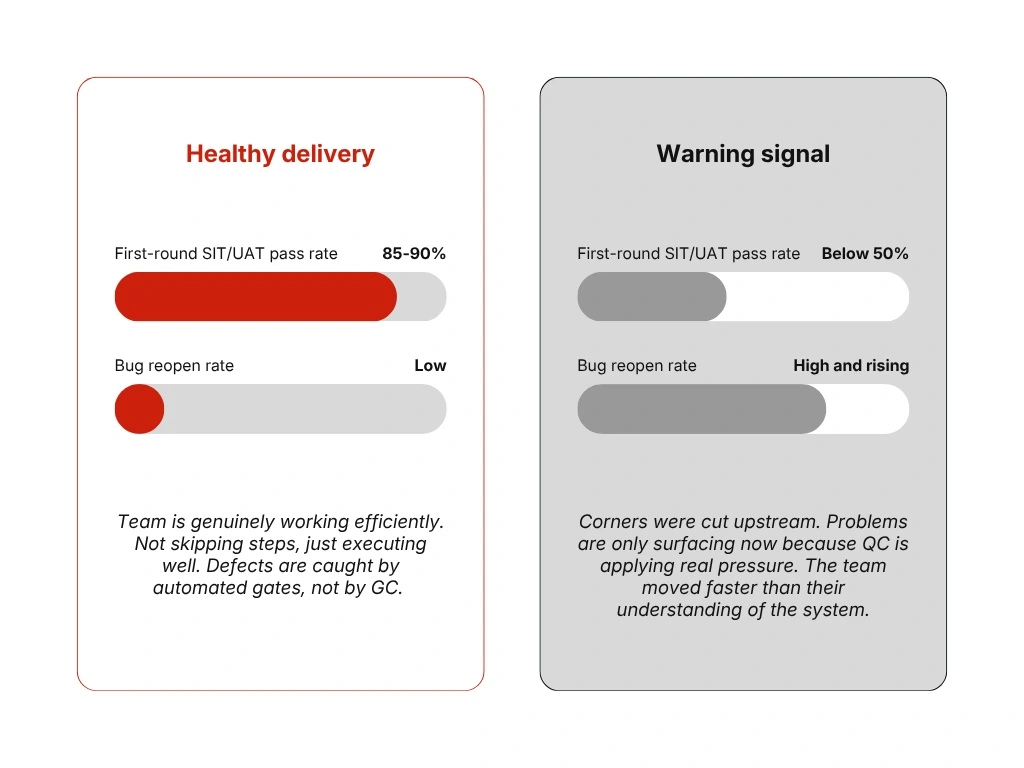
This cognitive disconnect is exactly why Synodus pays meticulous attention to the SIT/UAT first-pass rate.
Unlike internal development metrics, SIT/UAT measures whether the software actually behaves correctly under real-world business validation. When pass rates plummet and reopen rates soar, the root cause rarely lies within the testing phase itself.
In almost all cases, a failing first-pass rate is the starkest indicator that a team has simply moved faster than its own understanding.
The hidden cost most teams never see
Over the past year of intensive AI integration, one overarching lesson has become undeniably clear: no single metric is sufficient on its own.
- Delivery speed can improve while operational costs paradoxically increase.
- Code volume can skyrocket while foundational quality silently deteriorates.
- Feature throughput can accelerate while alignment with business validation weakens.
This multifaceted reality is precisely why Synodus synthesizes multiple signals into a unified framework. We concurrently track:
- Effort per Feature
- Bug Reopen Rate
- Code Quality
- Unit Test Coverage
- SIT/UAT First-Pass Rate
- Token Consumption per Feature
Together, these interwoven metrics reveal the unvarnished truth: whether AI is forging genuine, long-term delivery gains, or simply sweeping complex problems into a later stage of the lifecycle.
What this means for engineering leaders
Despite the rapid evolution of technology, a concerning number of organizations still evaluate their AI adoption using outdated, output-driven metrics. More code. More features. Higher velocity.
Those numbers matter, but they no longer tell the whole story.
The organizations securing the greatest competitive advantage from AI have stopped measuring mere output. They are asking profound questions:
- Is the actual process of delivery becoming easier?
- Is the underlying stability of the system improving?
- Is the intrinsic quality of the code increasing?
- Does the team still fully comprehend what they are building?
AI has fundamentally changed how software is written. By extension, it must dictate a fundamental change in how software is measured.
Speed is seductively easy to see. Sustainable delivery is notoriously harder. The ultimate responsibility of a modern measurement system is not to applaud velocity, but to make that sustainability clearly and undeniably visible.