Making use of data modelling to optimize storage & transportation costs.
Industry
Recreational Facilities, Retail
Services
Data Visualization, Data Science
Tools
Power BI, SQL, Python
Status Quo
Our client is a retail company with outdoor camping equipment products that have been consumed in Australia with average annual revenue of 39 million AUD.
Regarding the current situation, the company has a lot of data from different sources, which makes it difficult for the owners to monitor the business situation and make decisions based on the data.
CHALLENGES:
Warehouse: Although all the data was already centralized and stored in different .csv files on AWS3, the format has not been friendly, making it difficult to query and affecting the loading speed.
Reports: They do not have enough capability to optimize every report they have made (it takes nearly 30 seconds to load a page on average), let alone the fact that they just have sales & marketing-related reports.
Storage Costs: The fact that the main products are pieces of outdoor gear, which require a very large area to store means it cost them a huge amount of money.
The company structure: The client has a complicated business structure that is not easy to manage and distribute the report system.
Our Solutions
Building Data warehouse: We built a data warehouse on SQL database, in which all the data would be updated every 10 minutes.
Delivering Reports: We optimized the data model, DAX and a wide range of charts in existing BI reports. Moreover, our data analysts built a reporting system in Power BI for the client to cover all business areas, which include but are not limited to sales & marketing, finance, and customer support
Optimizing storage costs: Creating a model to forecast the number of sales and revenue periodically to help the client estimate the number of goods imported in a period of time.
Guiding the client to have a more effective organizational structure: We consulted our client to use row-level security (RLS), which helps to make sure that each staff can only access data that they are granted to do and assign permissions by each department.
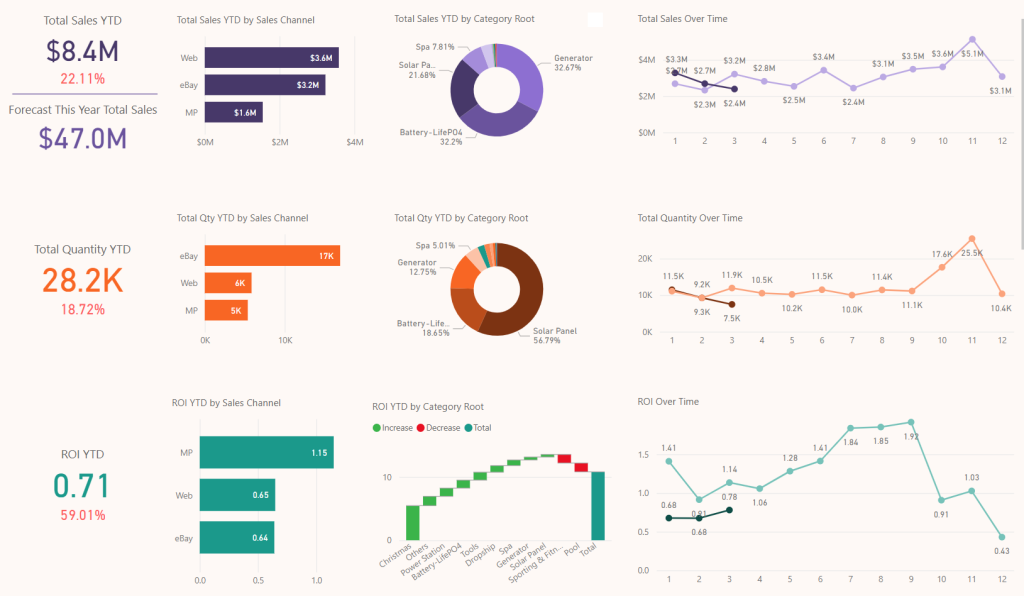
Sales overview
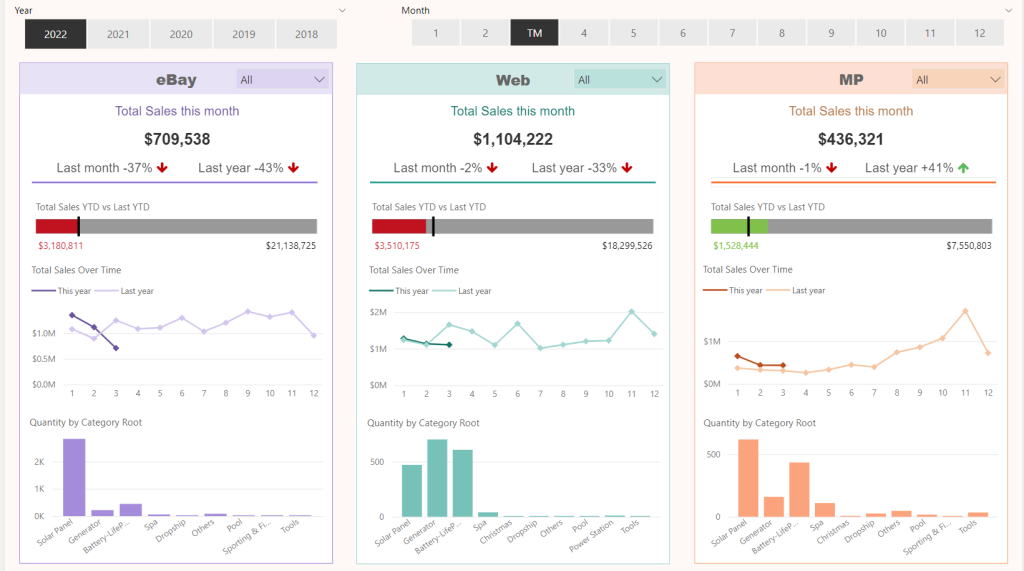
Sales by channel
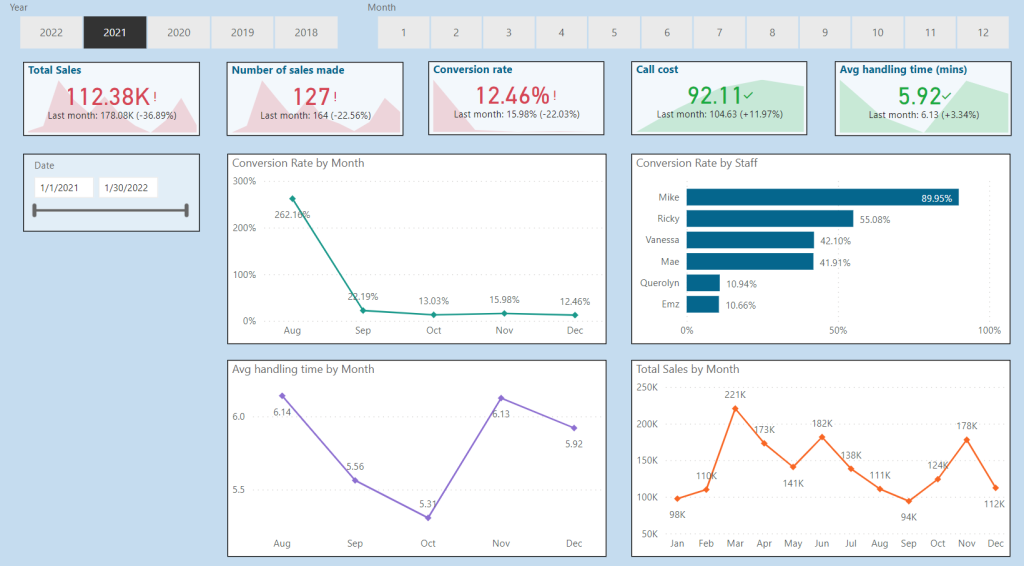
Conversion report
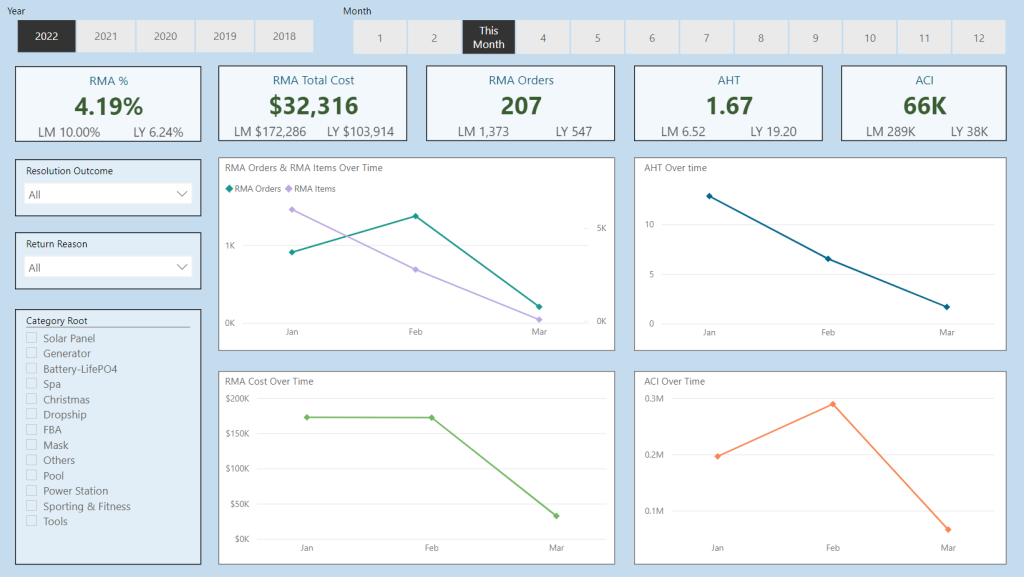
RMA
Previous
Next
Results
Speed up reports
The loading speed is reduced from 40 seconds to 3 seconds, helping users to have a better user experience.
Well-designed data visualization improves understanding
With more user-friendly & customized reports for each department, the managers and team in each department could answer critical questions such as: Which products bring the most revenue? What is the most common reason for buyers to return purchased items? Which courier has the lowest shipping cost and highest-rated delivery experience?…
Reduce warehousing & transportation costs
We used a model to forecast sales which reduced the cost of warehousing by 23%. A new calculation formula was also developed to optimize the gap between courier shipping costs and customers’ shipping fees.
Related cases
Browse some related cases to inspire your business and make your decision to partner with us
Get a fully-stacked data team within 47 hours without making a hire. Our team of data experts help build your data infrastructure, create your metrics and much more. Available from day 1, so you can get a world-class data setup in record time.


")
