From the straightforward charts to the dynamic, captivating images, data visualization techniques have gone a long way. It not only changed the methods data analysts apply, but also the way we tell stories, with statistics. Let’s examine the 5 data visualization latest trends below, to preview what visualizations in the future look like and how to adapt them well.
Data Visualization (Data Viz) Market Growth And Opportunities
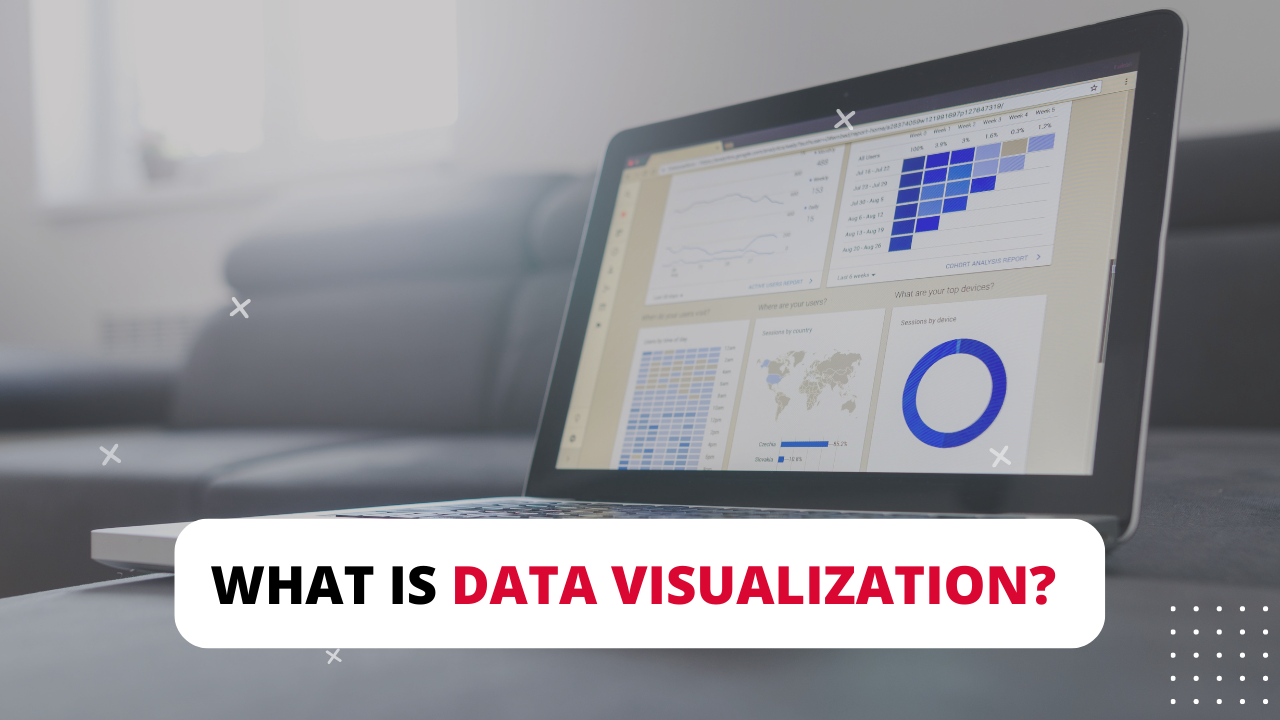
Data visualization (Data Viz) can significantly add value by graphically communicating massive datasets, making them easier for analysts and retailers to understand. In a data-driven environment, any organization can have a stronger grasp of important consumer data.
During the COVID-19 pandemic, the increased demand for work-from-home and remote working policies contributed to the growth of global data analytics and remote management solutions, energizing the demand for data visualization tools businesses.
However, challenges related to data protection and data sharing on data visualization tool platforms may influence predictions for the data visualization tool market. Conversely, the integration of modern tools such as machine learning and data analytics with data visualization tool solution suites is predicted to offer lucrative opportunities for the advancement of the data visualization tools industry over the projection period.
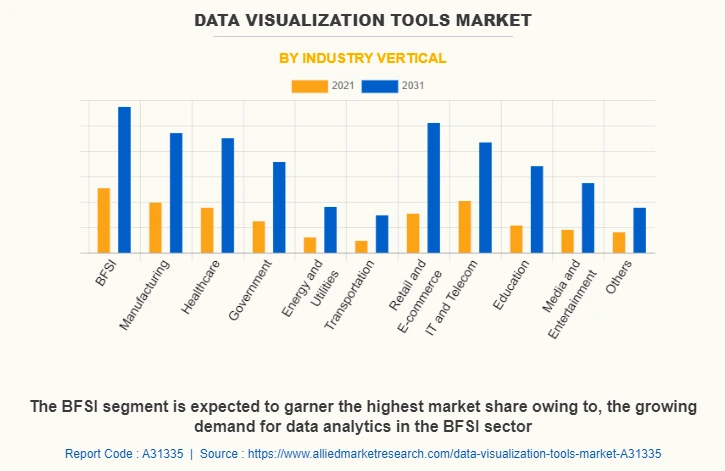
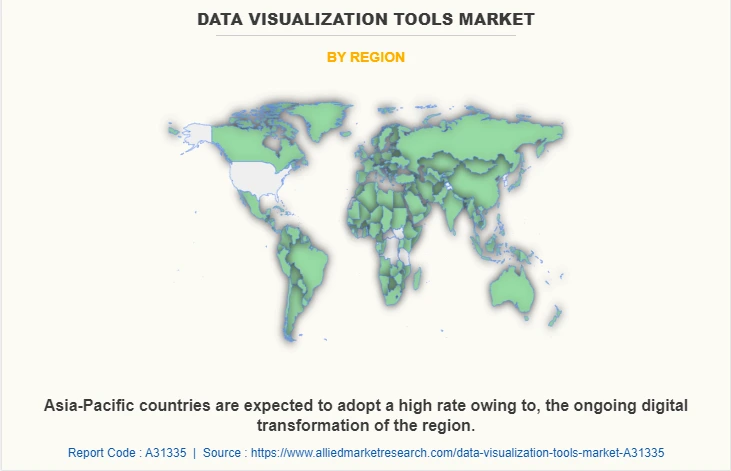
According to the Data Visualization Tools Market report in 2022, the worldwide data visualization tools market was valued at $7.4 billion in 2021 and is expected to reach $19.5 billion by 2031.
- By industry vertical: The BFSI (Banking, Finance Services, and Insurance) segment dominated the data visualization tools market share in 2021. This trend is expected to continue during the forecast period, encouraging major businesses in the sector to invest in effective data visualization tools and solutions for their organizations. Conversely, due to the growing popularity of e-commerce and online retail firms, the retail and e-commerce industry is predicted to experience the most growth in the next few years.
- By region: North America dominated the data visualization software market in 2021 and is expected to maintain its position during the projected time frame. However, Asia-Pacific is predicted to experience significant growth throughout the projection period due to rapid economic and technological advancements, which will drive the expansion of data visualization tools solutions in the region in the coming years.
Data visualization tools not only help company managers harness the potential of their data, become more adaptable, and respond more quickly but can also determine the impact of various factors on their global data market share.
Top 5 Trends Of Data Visualization
You may use data to provide your firm a competitive advantage by enabling the correct applications to organize your data and make your visuals. Following that, let’s go through the five most popular and powerful data visualization trends that would dramatically drive the market in the future.
Data Democratization
Data used to be known as being difficult to grasp. It required the attention of data scientists and other technical staff to unlock its secrets. This does not have to be the case. Advanced no-code data analysis tools can analyze and unlock your data automatically. This makes it adaptable and simple to show in any Data Visualization mode your staff of whatever degree of computer expertise can conjure up.
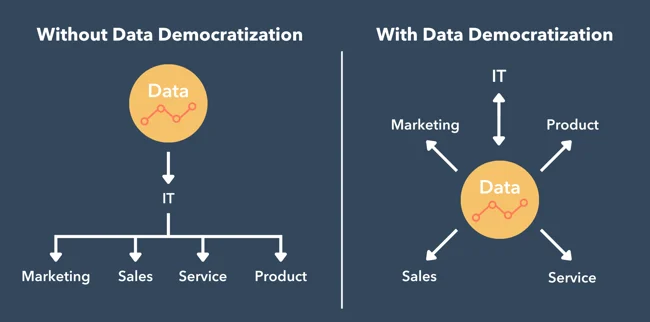
Therefore, democratization is one of the emerging data visualization trends. When combined with an efficient data visualization type selection, it may unleash big data outcomes for teams at all levels inside your business, while leaving your technical personnel alone and without any restrictions on access.
Making data-driven insights available to all users within an organization and almost without code is a reasonable step. It enables users to access and visualize data, as well as create dynamic customized dashboards, with only a few clicks. This aids in the identification of new business possibilities and solutions to problems, as well as the collection of ideas and innovations from across the enterprise.
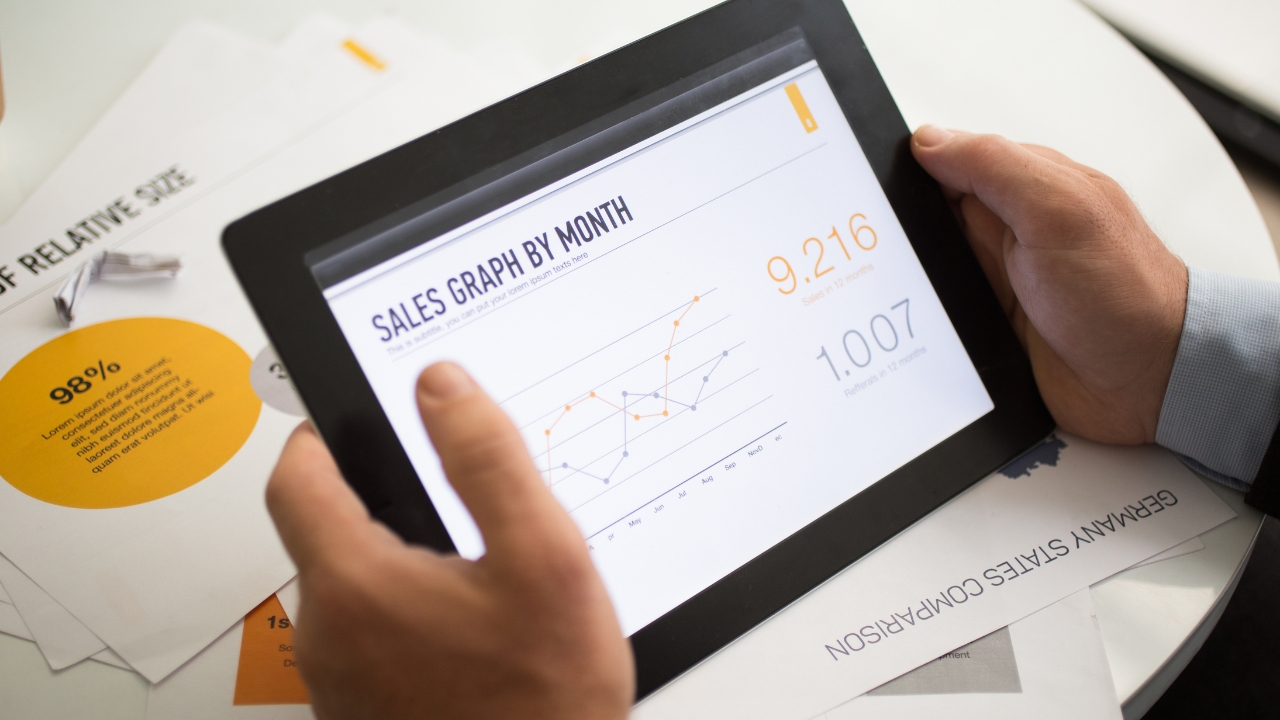
Real-time Data Visualization And Analysis
It is important to recognize an issue as soon as it occurs. A company’s bottom line may be significantly impacted by early identification in business strategy, client retention, and brand visibility. Acquiring real-time insights from data, this future trend of data visualization gives businesses a distinct advantage over rivals.
According to a DataStax poll in 2022, real-time data is a “must-have” for 78% of participants, and it directly affects revenue growth for 71% of them.
Real-time data visualization enables organizations to identify new possibilities earlier than competitors, manage risk more effectively, and make strategic choices more quickly. For an even more potent examination, business users may create dashboards that use both historical and real-time data.
Animated And Interactive Visualizations
Another trend in data visualization is providing information through interactive and animated Data Vis.
As a matter of fact, around 65% of people learn best visually and retain knowledge best when given in a video format, and considering people’s short attention spans in today’s world, animated visualizations catch the eye of users more than text or static visualizations, and they also stand out amid other digital information. With this kind of representation, authors may convey ideas and create tales without using a lot of words.
Since the early 2010s, basic data animations have existed, although their emphasis has been on flamboyant motion and ill-defined graphics. Modern visualization methods are far more comprehensive when data makers may now create 3D zooming experiences, offset and delay information, and display data linkages.
Data Visualization Content On Social Media
These days, data visualization appears more often in the Internet social life, being shared on a variety of social media platforms, and engaging a large number of followers and watchers. This trend has also been noticed by data scientists, who are now concentrating more on social media-friendly visualizations that will increase followers’ engagement on social media.
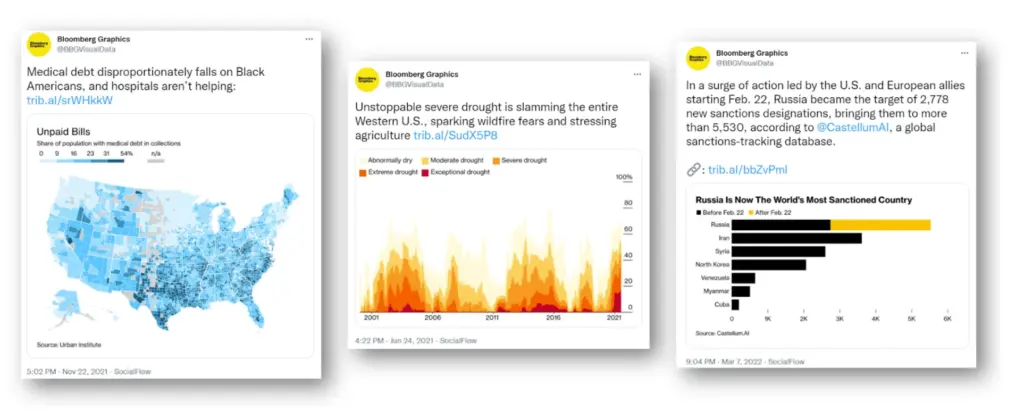
Users of social media have very short attention spans, so information needs to be clear, brief, aesthetically appealing, and to the point. For social media sharing, data visualization adheres to the “less is more” principle. GIFs, 3D animations, and content and data visualizations for well-known video-sharing applications are a few examples of social media visualizations.
Data Visualization Presented By Storytelling
People are more likely to remember stories than dry facts because they are emotionally invested in them when they are told. There are significant tales that data and numbers can tell, but they need your help to be heard loud and clear. The notion of using data visualization to tell stories and interpret statistics is gaining traction.
It is insufficient to only visualize the data, though. Data visualizers should strive to become storytellers by first understanding the significance of the data and then crafting a narrative that keeps the audience interested in the data while assisting them in deciphering its meaning. This is accomplished by arranging a variety of visualizations in a way that guides your audience through the data and aids in their development of insightful conclusions.
Although it may seem difficult to create these kinds of visual tales from complex data sets, if done well, they may help set your data visualization apart and provide you an advantage over competitors.
Industry-specific Data Visualization Trends
Each industry has its unique data visualization needs and trends to address specific challenges and leverage opportunities. Let’s explore some of the emerging industry-specific data visualization trends that are transforming decision-making and insights across different sectors.
Healthcare
Patient Data Tracking
Patent data tracking involves the analysis and visualization of information related to patents in the healthcare industry. This data is crucial for understanding technological advancements, identifying emerging trends, and assessing the competitive landscape.
Natural Language Processing (NLP) techniques for patent analysis are being increasingly used to extract valuable insights from patent documents. NLP-powered tools can also categorize patents based on their relevance to specific healthcare domains, making it easier to track developments in targeted areas.
Also, the geospatial visualization techniques help visualize the geographical distribution of patents and innovation hotspots. This information can be useful for identifying regions with a high concentration of research activities, potential markets, and areas for investment.
By tracking patent data, healthcare organizations, researchers, and investors can stay informed about the latest innovations, make strategic decisions, and identify potential collaboration opportunities.
Medical Imaging Visualization Advancements
Medical imaging plays a vital role in diagnosis, treatment planning, and monitoring patient progress. The visualization of medical imaging data has seen significant advancements, enabling healthcare professionals to extract valuable insights and improve patient outcomes.
3D visualization techniques allow medical professionals to view medical images in a three-dimensional format, providing a more comprehensive understanding of complex anatomical structures. Virtual Reality (VR) technology is also being integrated into medical imaging visualization, enabling users to immerse themselves in a virtual environment and manipulate 3D models for enhanced visualization and surgical planning.
Moreover, the integration of medical imaging data with electronic health records streamlines the visualization and accessibility of patient information. By having a consolidated view of medical images and patient data, healthcare professionals can make more informed decisions and provide better continuity of care.
Marketing
Customer Behaviour Analysis Visualization
This trend includes the analysis and visualization of data related to customer interactions, preferences, and purchasing patterns. This data is essential for marketers to understand their target audience, personalize marketing strategies, and optimize customer journeys.
Moreover, by analyzing and understanding demographic and behavioral data more thoroughly, data visualization may assist you in developing lead nurturing programs that are especially designed to move leads farther down the sales funnel and in lead categorization by segment.
By utilizing heatmaps, clickstream, social media listening, sentiment analysis, etc., marketers can gain valuable insights that drive effective decision-making and improve marketing outcomes.
Marketing Campaign Performance Dashboards
Marketers will be provided with a consolidated view of key metrics and insights related to their campaigns when adapting to this trend. These dashboards enable marketers to monitor campaign performance, track important KPIs, and make data-driven decisions to optimize marketing strategies.
Choosing the ideal target market and creating tailored message that will increase the likelihood of a sale are no longer the tough tasks. You even can optimize budget allocation by concentrating on what works best and make real-time adjustments to your campaigns depending on campaign results.
Education
Interactive Learning Through Data Visualization
Interactive and dynamic data visualizations have gained popularity in the education sector due to their ability to engage learners and provide a more immersive learning experience. These visualizations allow users to interact with the data, explore patterns, and develop critical thinking skills across various subjects.
For example, students can interact with a graph or chart, change the parameters, and observe how it affects the data representation. This trend not only enhances student engagement but also promotes a deeper understanding of complex concepts.
Visualizing Educational Performance Metrics
This is another important trend in the field of education. It involves the use of data visualization techniques to present and analyze key performance indicators (KPIs) and metrics related to student achievement, such as test scores, attendance rates, and graduation rates.
By visualizing these metrics, educators and administrators can gain valuable insights into student performance and identify areas of improvement. Visualizations can highlight trends, patterns, and outliers that may not be immediately apparent in raw data. This enables educators to make data-informed decisions and implement targeted interventions to support student success.
Visualizing educational performance metrics also promotes transparency and accountability. By making these metrics accessible to stakeholders, such as parents and policymakers, data visualizations can facilitate informed discussions and decision-making regarding educational policies and resource allocation.
How To Stay Up-To-Date With Data Visualization Trends
For Data Analyst
Whether you are a novice or a seasoned expert, it is a must to stay current on trends, tools, and approaches in this ever-changing area to demonstrate the abilities and originality of any data analyst. Here are some notes and tips to keep up with data visualization trends that would highlight the portfolio.
- Follow data visualization professionals
It is advisable to update and learn from visualization gurus on social media, blogs, podcasts, newsletters, or online courses. This is one of the finest ways to be inspired by the master’s work, giving you fresh ideas, insights, and resources for your own initiatives.
Many popular and renowned data visualization specialists may be found on sites such as Twitter, LinkedIn, Medium, YouTube, and Udemy. The name that we can mention are Edward Tufte, Alberto Cairo, Cole Nussbaumer Knaflic, Andy Kirk, Nathan Yau, etc.
- Discover data visualization galleries
Exploring data visualization galleries that display the greatest and most creative examples of data visualization from many disciplines and genres may be a fantastic source of inspiration and learning for your portfolio. You may go through these galleries to learn how different data visualization professionals and practitioners utilize diverse tools, approaches, and styles to successfully and artistically express their data stories.
The Pudding, Information is Beautiful, Visualizing Data, FlowingData, and Visual Capitalist are some well-known data visualization galleries.
- Participate in data visualization communities
Another approach to keep current and engaged in the field of data visualization is joining in online or physical forums where you can communicate with other data lovers, share your work, receive comments, and learn from others. There are several data visualization communities catering to various degrees, interests, and domains. Being in these groups will also provide you with the opportunity to engage in challenges, events, and contests that will help you build your portfolio.
Data Visualization Society, Storytelling with Data, Makeover Monday, Data is Beautiful, etc. are among the most popular.
- Practice with different data visualization tools
To stay updated with data visualization trends, you should also experiment with various data visualization tools that may assist you in creating spectacular and dynamic data visualizations. Gaining new abilities, broadening your arsenal, and diversifying your portfolio are all the benefits you can get.
There are several data visualization tools on the market, ranging from free and simple-to-use options like Google Charts, Plotly, and Datawrapper to more powerful and configurable options like D3.js, R, and Python.
- Examine your portfolio of data visualizations
Moreover, you should check your data visualization portfolio on a regular basis and update it with your most recent and finest work. It is also better to assess your portfolio based on input from peers, clients, or employers, and find areas where you can improve or highlight your skills. Don’t forget to recheck whether your portfolio reflects your own style, aims, and beliefs, as well as whether it is in line with current trends and standards in the data visualization area.
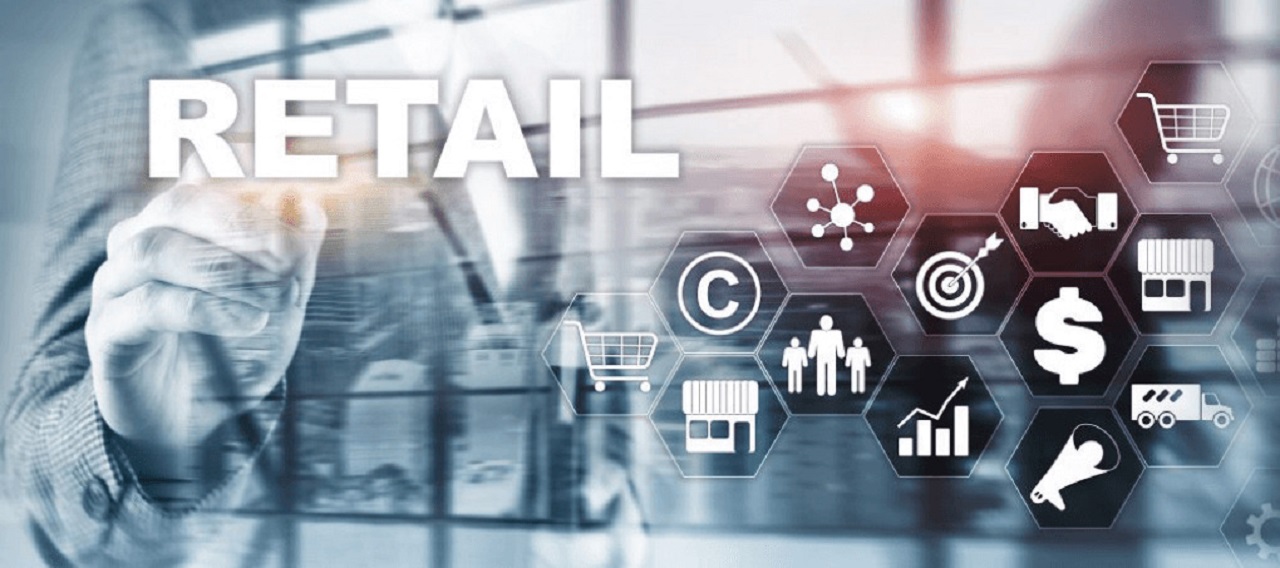
For Retailers
Retailers have to manage data from several divisions, including sales, marketing, logistics, and inventory. Moreover, the volume of data accessible is enormous, and even if you are successful in properly storing and processing it, you may still be unable to understand it all, particularly if you lack a trained data scientist on your team. Two pieces of advice for retailers are:
- Firstly, every seller needs to understand all types of data vis that support their work and learn how to truly comprehend also generate insights from them. Let’s start with some simple but thorough reports on customer behaviors or the level of business operation.
- Another issue relates to the huge amount of data that needs to be handled. This is when we must utilize the customer data platform or partner with the outsourcing data team for effective support.
| Suggested for you: Revealing 8 Trends In Retail Analytics To Gain A Competitive Edge | |
Wrapping Up
Data visualization has developed into a crucial tool for companies looking to successfully share their findings with a larger audience. It is now even more important to follow the most recent trends in data visualization in order to stay competitive, given the growth of digital media and the daily generation of ever-increasing amounts of data.
Using these forecasts in your data visualization approach may assist you, as a marketer, data analyst, or company owner, present complicated data in a simple and visually attractive way. Businesses may use the newest technologies and trends to tell powerful visual tales that captivate audiences, build their brand, and help them accomplish their objectives.
If you want to build engaging visual tales that captivate and encourage participation from the target audience, don’t hesitate to contact Synodus immediately. Our committed consultants are always ready to give the best advice and suitable solutions for your business development.
More related posts from Big data blog you shouldn’t skip: